Turbo-Chart - Visualizing Linear Project Schedules - South East Asia Time - 2018-01-29
Description
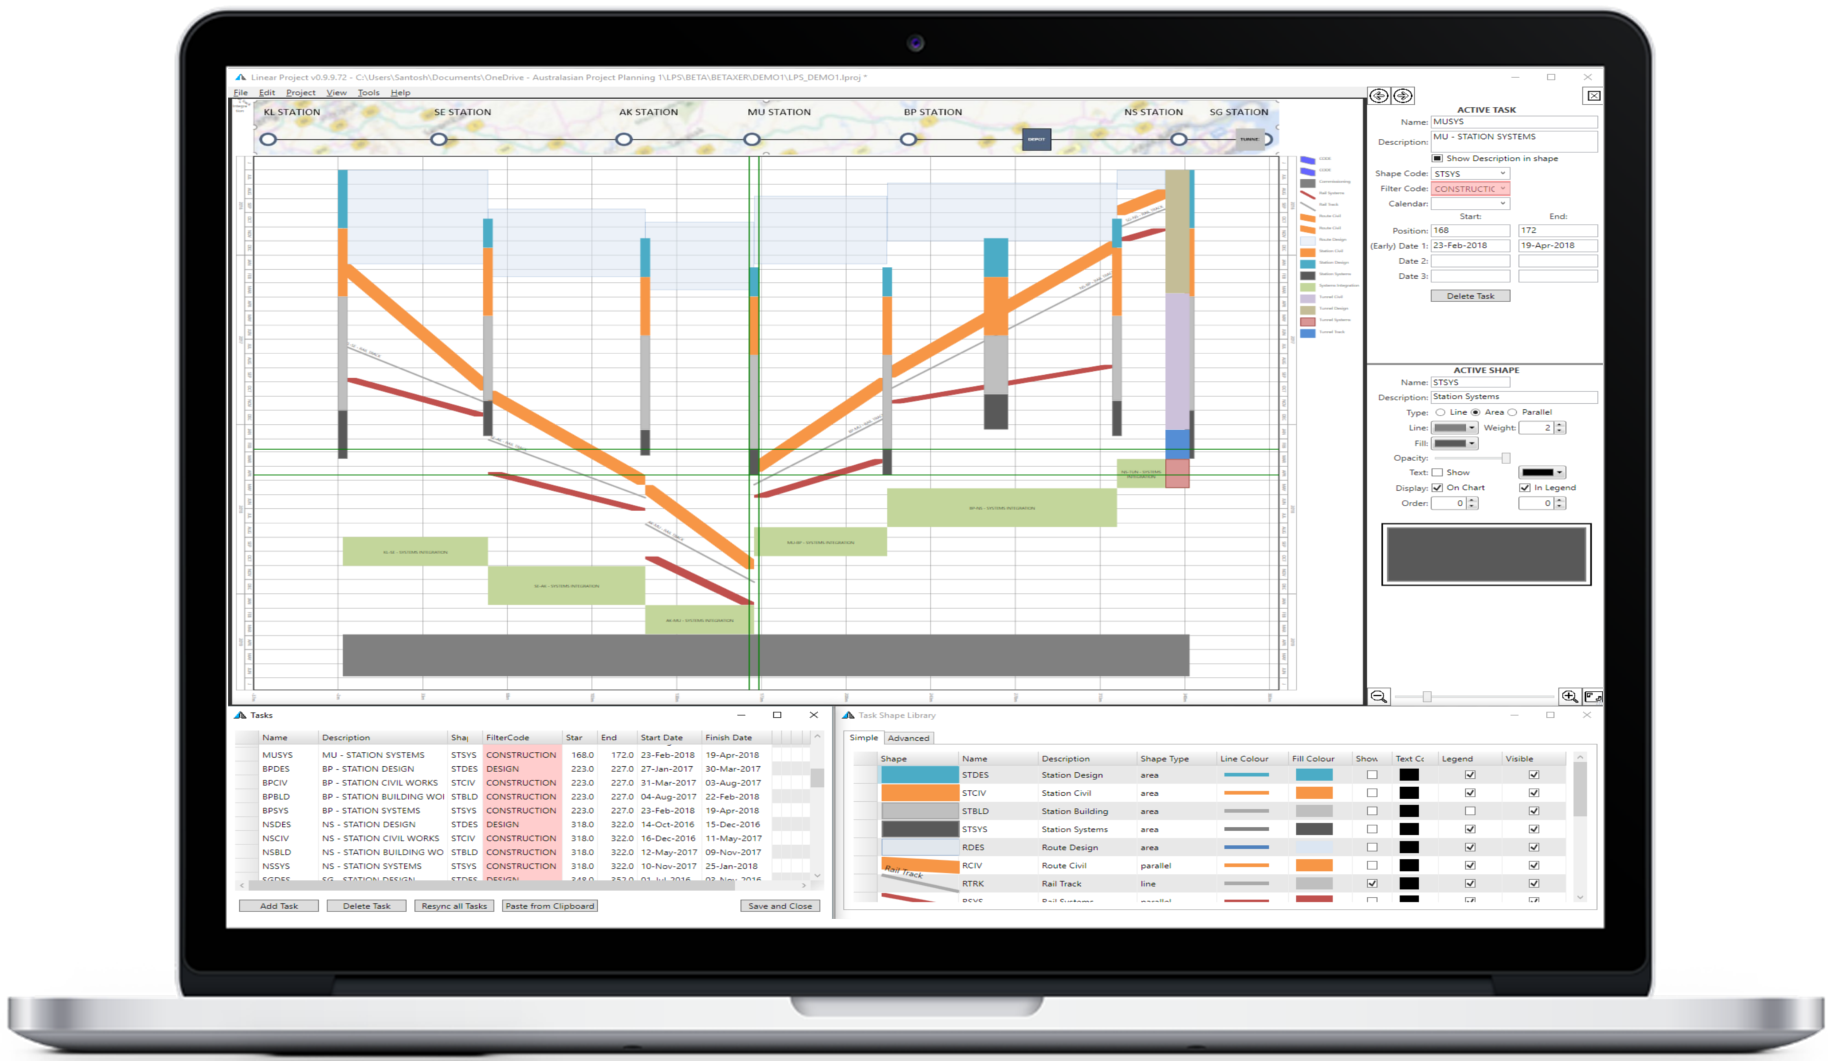
Turbo-Chart is a new tool for generating Time Location charts that are used to visualize linear project schedules. Turbo-Chart works alongside scheduling tools, such as Primavera P6 and Microsoft Project, and produces Time Location charts based on existing schedule data. This tool is ideal for building, roadway, tunneling, rail and pipeline projects to name a few.
Come see how your team can keep using their centralized planning software, and quickly get the reporting they want using TurboChart.