Why You Should Upgrade From Oracle Primavera Risk Analysis to Safran Risk – Part 3
I’m Ian Nicholson, VP Solutions at Emerald Associates. I have been working with Oracle Primavera Risk Analysis (OPRA) since 2001 when it was Pertmaster, Emerald being the exclusive Canadian distributor for Pertmaster until their acquisition by Primavera in 2006.
In this series of blogs, I will explain why I feel that all OPRA users should upgrade to Safran Risk (SR).
Part 3: Integrated Cost and Schedule Risk Analysis
Many years ago, I was hired by a large multinational oil and gas company considering a new technology project. My role was to conduct a schedule risk analysis in preparation for a go/no-go decision from The Board. Another consultant was conducting a cost risk analysis in parallel to mine. The company expected us to each present our results but not to discuss the results with each other. The results would be independently used when considering whether or not the company was going to invest billions of dollars in their project.
The cost risk consultant and I discussed the issue and since we agreed that cost and schedule risk were intrinsically linked and we looked at ways that we could combine the two analyses. Our options were limited:
- We could build a cost loaded schedule in OPRA and conduct a joint analysis in that tool. The challenge that we faced was that the cost line items didn’t line up with the project schedule in a way that would make this easy to do. Not only that, but only some of cost risks were schedule related, not all of them. We would need to build a cost loaded schedule specifically for the analysis, which, while possible, would take a lot of time and effort.
- We could take the results of the schedule analysis and incorporate them into the cost analysis in @Risk. This could be done by creating a single point duration value or a simple time based distribution for certain cost items, like our indirect costs. For example, we could say that our site services (trailers, security, staff, etc) would be required for a P70 value of 60 months as opposed to the deterministic value of 48 months, but it lost a great deal of the dynamic aspects of the schedule analysis because the integration was done at a high level.
The oil and gas industry has largely followed Option 2 as the easier approach but really what we needed was to develop the two models concurrently, so that uncertainties and risks in both cost and schedule impact each other in the Monte Carlo simulations. Changes in one can affect the other immediately and visibly.
Why is it such an advantage to have both in the same model?
There is an old project manager’s joke that says, “You can have it good, you can have it fast, you can have it cheap – but you can only pick two of the three.”
- If a project is running late, there will be additional costs associated with indirect costs and in most cases there will be additional costs associated with direct costs as well.
- If the project team decides to spend money to save time (mitigate delays), the costs will likely increase.
- We may decide to mitigate cost risk by slowing the project and keeping a smaller, more efficient labor force or by moving work to a known fabricator.
A recent study of Oil and Gas mega-projects in Alberta showed that, on average, there was a 19% cost overrun and a 17% schedule overrun on these very expensive projects. It is certainly no surprise that these numbers are so closely correlated. Yet we make decisions on cost mitigation strategies and schedule mitigation strategies without insight into the impact that our change will make to our schedules and cost. On the oil and gas project that I mentioned earlier, cost and schedule mitigation strategies were considered entirely in isolation.
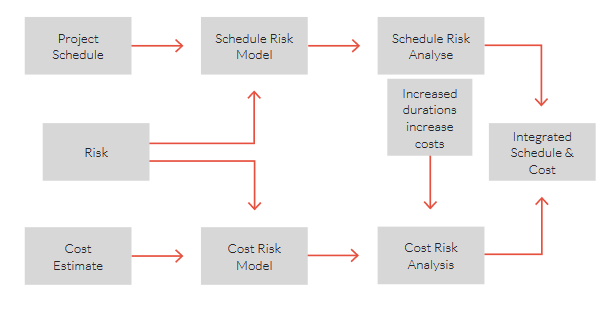
Figure 1: Integrated Cost and Schedule Risk Process
Often as project managers we get tunnel vision because we get too focused on schedule or cost at the expense of the other. For example, I worked on a turnaround project that had a $120M budget with a 35 day maintenance window. Management communicated that schedule was everything, cost was very much a secondary consideration (so much so that it wasn’t even monitored during the project), so the project team started burning overtime almost from the first shift to maintain the schedule. In the end we completed the work on time (to great fanfare) but months later, when all the invoices were in, we had spent $160M to do so. This caused great distress within the organization. A few heads rolled and the “Full speed ahead, damn the torpedoes” approach was never used within that organization again.
“Schedule pressure dooms more megaprojects than any other single factor” (E. W. Merrow)
What we really need to understand is not just the probability of achieving our end date or the probability of achieving our end cost, but the probability of achieving both concurrently. This is called the Joint Confidence Level (JCL). We want a solution that offers a 70% probability (for example) of achieving both cost and schedule and that will help us to understand the interdependencies between the two.
The AACE 57R-09 Integrated Cost and Schedule Risk Analysis Guideline describes the process of combined Cost and Schedule Risk Analysis and the process is well described in Dr. David Hewlitt’s book Integrated Cost-Schedule Risk Analysis.
OK, so now we understand why we need to conduct cost and schedule risk together. But why Safran Risk?
Safran Risk is one of the only tools on the market that evaluates Cost and Schedule Risk together. The beauty of their approach is that costs can be modelled separately or together with activity durations. You can even apportion part of an estimate line item to a schedule activity but leave the rest independent. This gives a lot of flexibility in modelling the risks on a project and avoids the frustration of trying to resource load a traditional CPM schedule to match a cost estimate.
We can also truly understand the impact of our mitigation strategies best by evaluating cost and schedule risks together. Safran Risk makes turning risks on and off for what-if analysis simple and mitigation costs and schedule impacts can be easily modelled.
Finally, we can plot our cost vs schedule risk outcomes using a scatter plot to create a Joint Confidence Level diagram which shows us the probabilities of hitting our cost and schedule targets.
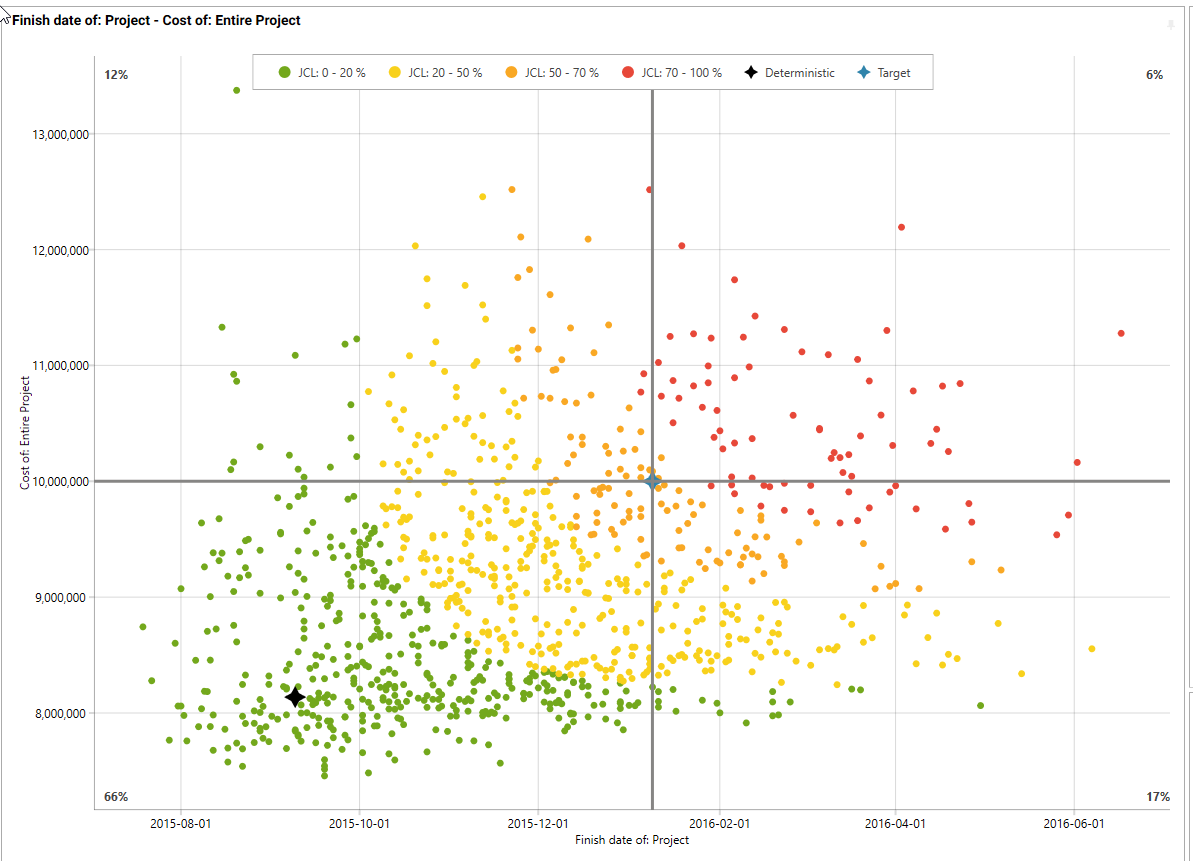
Figure 2: JCL @ 70% confidence – note that the deterministic cost and schedule probability (the star shape) is only 17%.
The Energy Facility Contractors Group (EFCOG) recently undertook an evaluation of the commercially available tools that can conduct cost and schedule risk together, which is a self‐directed group of contractors of U.S. Department of Energy Facilities. The purpose of the EFCOG is to promote excellence in all aspects of operation and management of DOE facilities in a safe, environmentally sound, secure, efficient, and cost‐effective manner through the ongoing exchange of information and corresponding improvement initiatives. You can see their report here.
Within this report, EFCOG chose Safran Risk as the best product for those working with Primavera P6 and second best for those working with Microsoft Project. Since most of my clients are working in P6 and need to conduct joint cost and schedule risk analysis, Safran is an obvious choice for those looking to better understand their projects.
About the Author
Ian Nicholson, P.Eng. - VP Solutions
As our VP Solutions and a Lead Risk and Implementation Specialist, Ian leads Emerald’s functional consulting group. With over 20 years of international experience in varied fields and roles from manufacturing, heavy civil construction, pharmaceutical plant construction, hospital projects and oil and gas capital and turnaround projects, Ian brings a wealth of project knowledge to all of our clients.
A visionary in the world of CAPEX, maintenance and turnaround planning processes, Ian has lead many of our large clients through their integration projects between ERP/EAM systems and Primavera products. Some of his integration success stories include Suncor Energy SAP to Primavera integration, BP Maximo to P6 integration, implementation of P6 at the Ontario Power Authority as well as the integration of Primavera Contract Manager with Oracle Financials at Capital Health Authority and Vancouver’s Rapid Transit Project 2000. Other major clients include Milwaukee Metropolitan Sewerage District, Shell Canada and Shell Global Solutions.
Ian has conducted Monte-Carlo risk analysis on CAPEX and turnaround projects for Shell Canada, Suncor Energy, Husky Energy and Bruce Power. He believes that successful Monte Carlo application is a process, not just a tool and has spoken at a number of events on the correct application of risk analysis.
When not assisting clients with their projects, Ian unwinds by riding his BMW motorcycle, listening to music or dragging his kids on long hikes.