Why You Should Upgrade From Oracle Primavera Risk Analysis to Safran Risk – Part 4
I’m Ian Nicholson, VP Solutions at Emerald Associates. I have been working with Oracle Primavera Risk Analysis (OPRA) since 2001 when it was Pertmaster, Emerald being the exclusive Canadian distributor for Pertmaster until their acquisition by Primavera in 2006.
In this series of blogs, I will explain why I feel that all OPRA users should upgrade to Safran Risk (SR).
Part 4: Analysis by Exclusion
A few years ago, I was working with a large mining company on their risk process. One of their risk specialists mentioned that they were performing risk analysis by exclusion. Naturally, I was curious as to what this was and asked them to show me how it worked.
What they did was to take the risk model in OPRA, run it with all risks, and then turn off one risk at a time and rerun the model. Then they would compare each output either in the Distribution Analyzer or in Excel, so that they could report exactly how much impact each risk had on the project.
The Tornado Chart in OPRA automatically ranks the activities or risks as to their impact, but the challenge is that while you can see which activity or risk has the highest impact, you cannot quantify what that impact is. The tornado is based on Pearson’s Product Moment which gives a percentage ranking which project managers find difficult to interpret. So, to answer the question of “What is the impact of this risk on the schedule?”, the OPRA user would:
- run the model with all risks turned on and record the results;
- manually turn off a risk, rerun the model, record the results;
- turn the risk back on;
- repeat step 2 and 3 to sample all risks in a project.
In the case of this client, they said that it would generally take about a week to perform the exercise on a large construction schedule, more if there were changes in the model or after a mitigation strategy session. This is simply too time consuming.
Another issue: They also had to use the Risk Factors module of OPRA to make the analysis work, making them one of the only clients of ours who ever used this module. This module works by allowing uncertainties to be modelled similarly to the Risk Register. This allowed uncertainties of the same type (Risk Factors) to be grouped for analysis and tracking.
While I could see the value of the work being done, the effort required was much too high. One of the tenets of working efficiently is that if you need to do something over and over again, you should look at automating it. Computers are good at repetitive tasks, people generally are not; automating repetitive tasks not only reduces time but also improves accuracy. For example, if you were to forget to turn Risk Factor #9 back on before turning off Risk Factor #10 risk for the 10th iteration of the analysis by exclusion effort, the project team might choose to act on the wrong Risk Factor because its impact was overstated.
I wondered if the VB capability in OPRA would assist in automating this task. While I didn’t use it much, I had heard that a lot of processes could be automated using the VB feature. So, I asked my friend and colleague, Russell Johnson, the ex-CTO of Pertmaster if analysis by exception could be automated using the VB feature of OPRA. His answer was:
While it’s technically possible there are a few big challenges.
- There was never a way with OPRA to create a native risk driver event (we did create a prototype module, risk factors, but this now means your model has new stuff added to it which can be confusing). So the first challenge is just creating and identifying a model with driving risk factors.
- There is no way to natively store or process the results. Since you are doing something outside the normal of what OPRA does, you'd have to find a new ways to store and display the results. You can't for example manipulate the built-in tornado chart.
- Finally, the speed is an issue. For various reasons OPRA is slow compared with Safran, so whatever you do will take much longer (like days vs mins, if it can even do it).
The other big issue is that OPRA dropped VB support years ago, so the argument is moot.
The developers of Safran Risk (SR) saw OPRA users performing this tedious, manual task and decided to automate it. The results are amazing; 40+ hrs of analysis in OPRA now takes minutes in SR and the chances of making a mistake are zero.
So how does analysis by exclusion work in SR? Let’s take a look.
First of all, the analysis can be performed in a single pass or in multiple passes.
- In single pass mode, it will run through each risk once, and show an output for all of the risks in the plan individually excluded (essentially the same exercise my client was performing manually).
- In multiple pass mode, the system will run for the number of iterations you specify and will remove the top risk from each iteration before starting the next iteration with the previous iteration’s risk left turned off. This has the advantage of preventing large impact risks overshadowing lower impact risks and will show the cumulative impact of mitigating each additional risk.
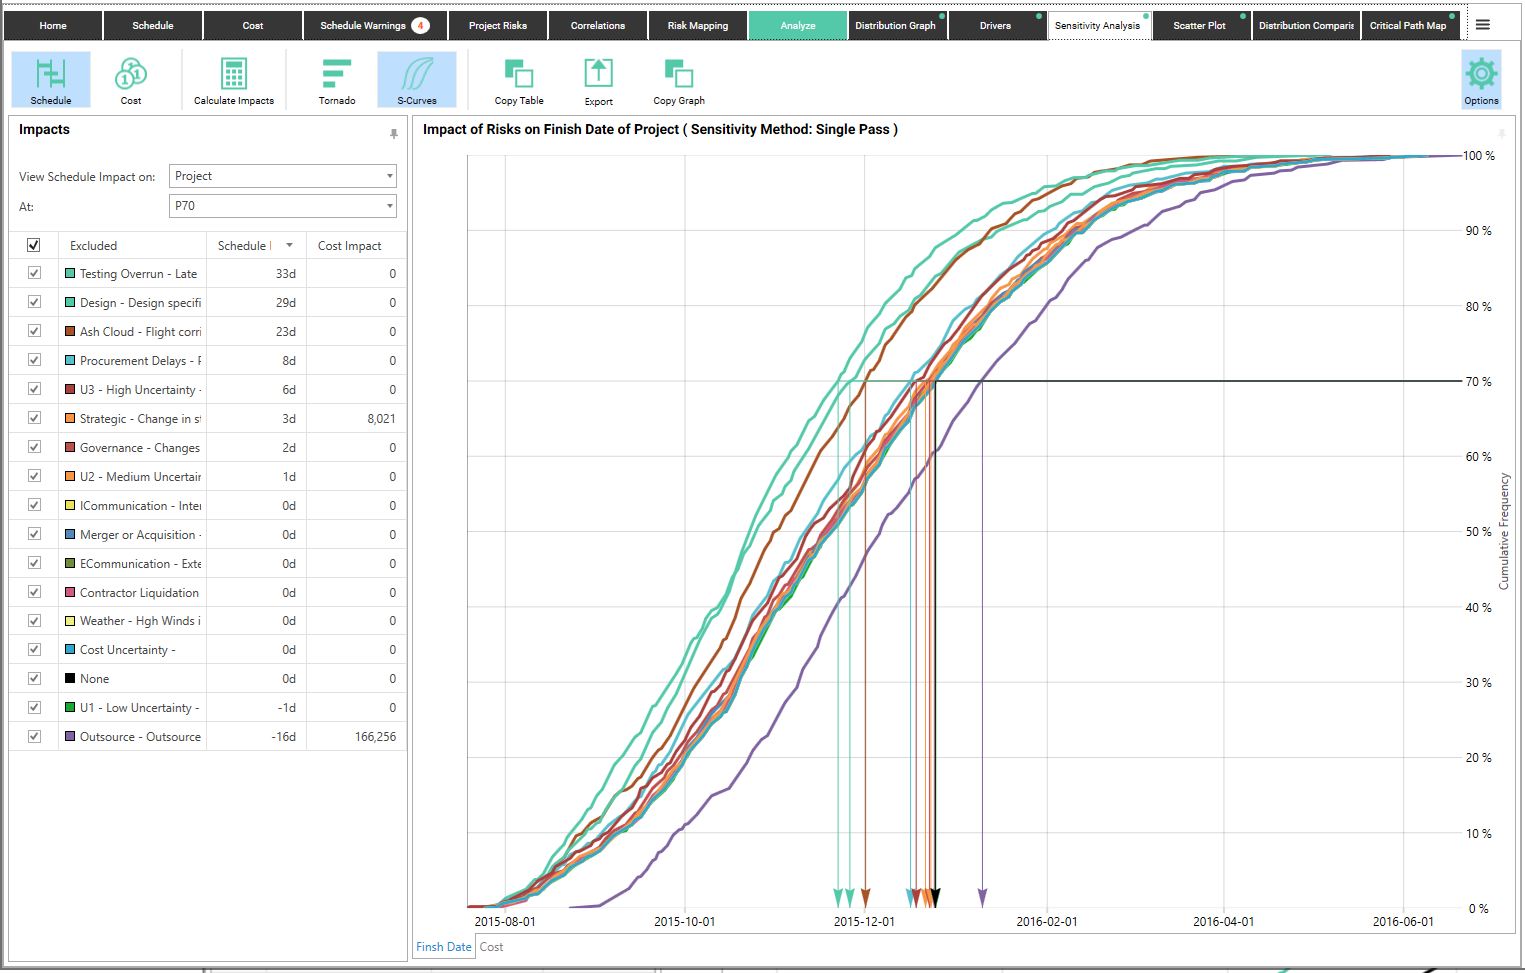
This is the result of the single pass analysis for all of the risks in the demo “Drone” project.
To show this better, let’s look at only one risk and one opportunity being removed compared to the original curve.
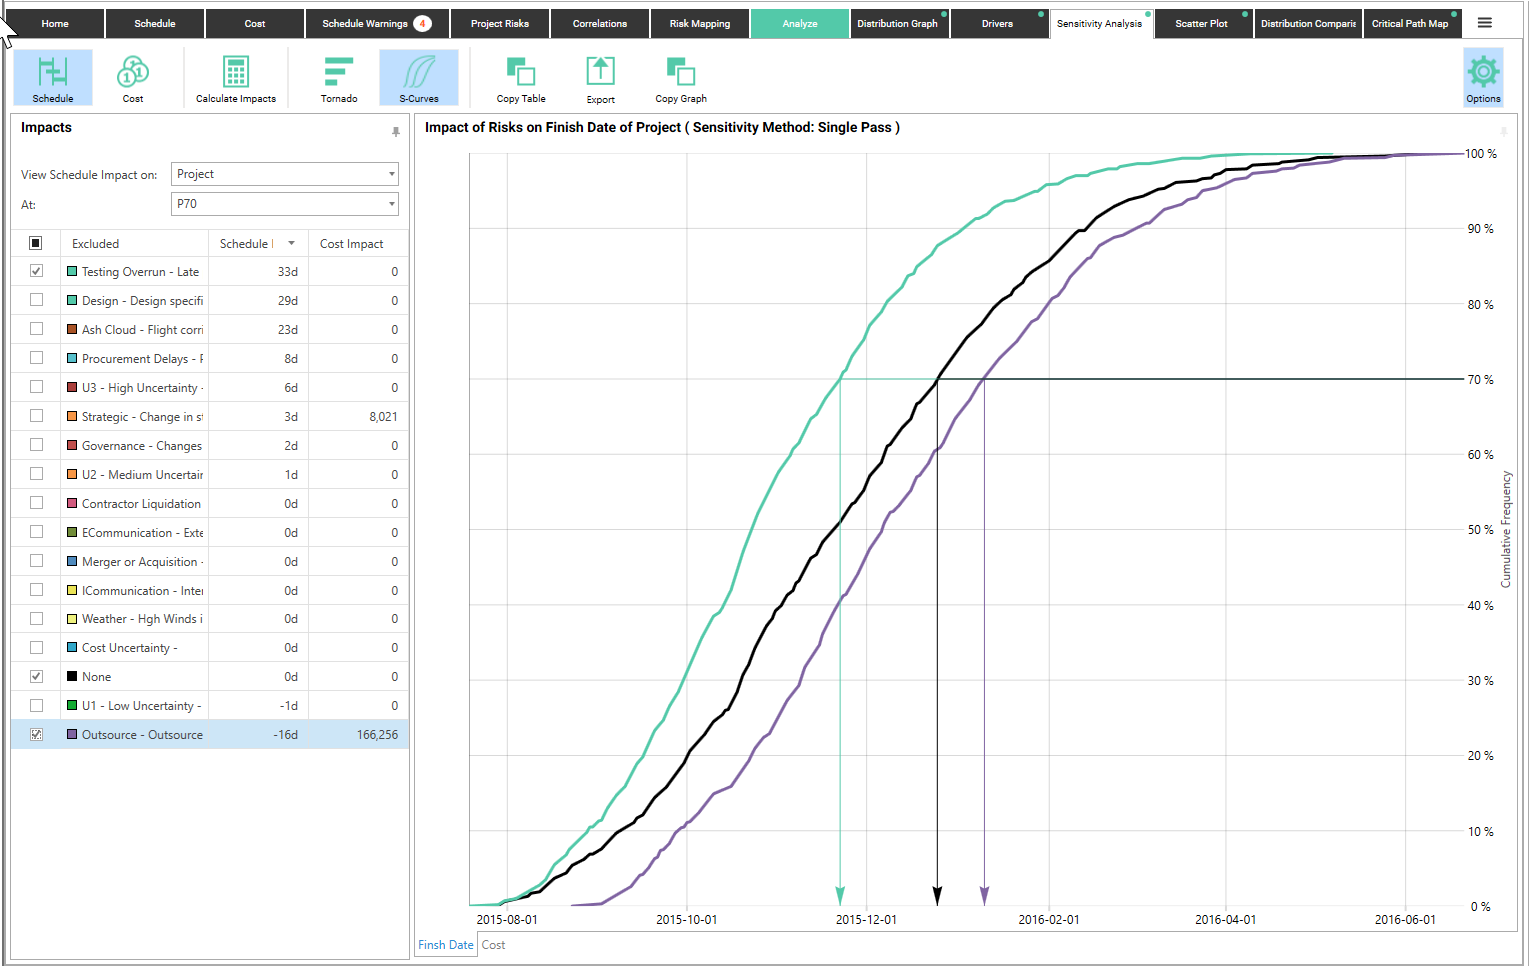
In this example, the black line represents all risks turned on (the “None” line) and the green line represents the same model with only the Testing Overrun risk turned off. This indicates that at P70, we would save 33 days if we could eliminate the Testing Overrun risk.
You can also see the effect of an opportunity in the purple line. The “Outsource” risk actually represents an opportunity. This shows that when the opportunity happens, the project duration is shorter (black line) than when the opportunity doesn't happen (purple line).
However, the cumulative saving of removing multiple risks is not entirely clear, since turning off additional risks may or may not save the sum of the savings obtained individually. In this example, if we turned off the top 5 risks, we would expect to save 103d. However, it is not that simple since turning off one risk may mitigate another risk, particularly if there is correlation between the risks.
We could do this manually by turning off the top risk, running the analysis, running the next risk, etc. but this is even more manual work.
To understand the interaction of the top risks, we run the same analysis but using multiple passes, turning off the top 5 risks cumulatively (ie pass one has only Testing Overrun turned off, pass two has Testing Overrun and Design turned off, etc.).
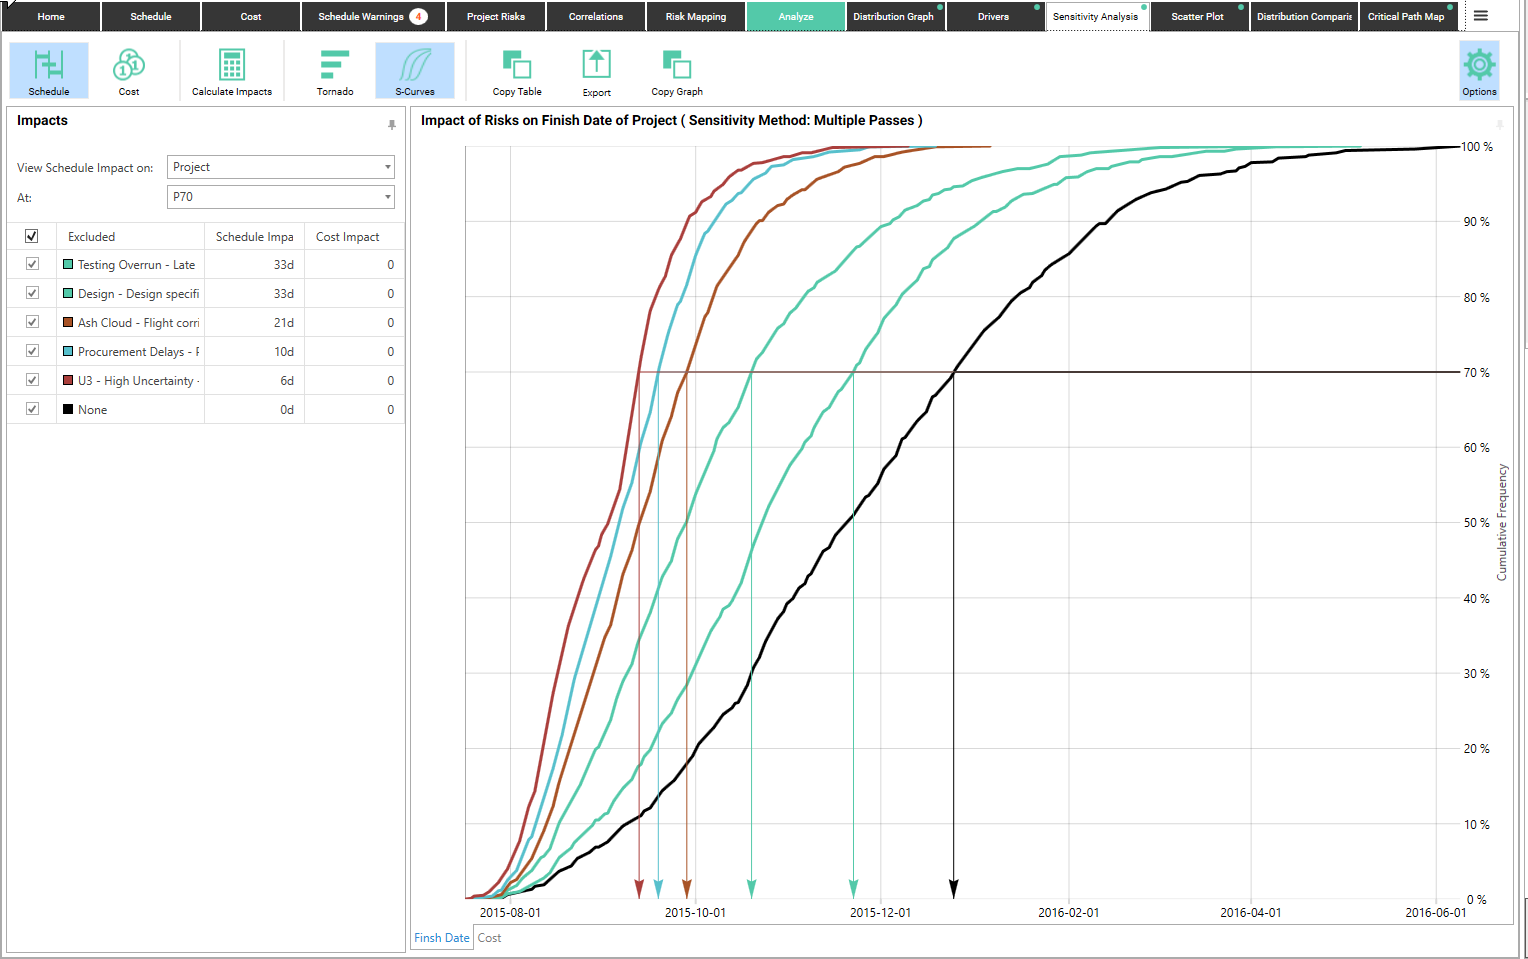
Again, looking at the P70 values:
- When the Testing Overrun risk is excluded, the schedule improves by 33 days (the same as the single pass).
- When Testing Overrun and Design are excluded, the schedule improves by another 33 days (a change from the 29 days of the single pass)
- When Testing Overrun, Design and Ash Cloud are excluded, the schedule improves by another 21 days (a reduction from the single pass result of 23 days)
- The total savings when we remove the top 5 risks is 103d. This is the same result as when we ran them individually, but the individual savings are different.
In a previous blog, I wrote about the advantages of integrated cost and schedule analysis and here, through the power of the integrated model, I can look at the same information but on a cost basis rather than only a schedule basis.
Here is what our cost Analysis by Exclusion looks like for all the risks. Notice that there are a few more risks shown in this display, since there are now cost risks that do not have a schedule impact included.
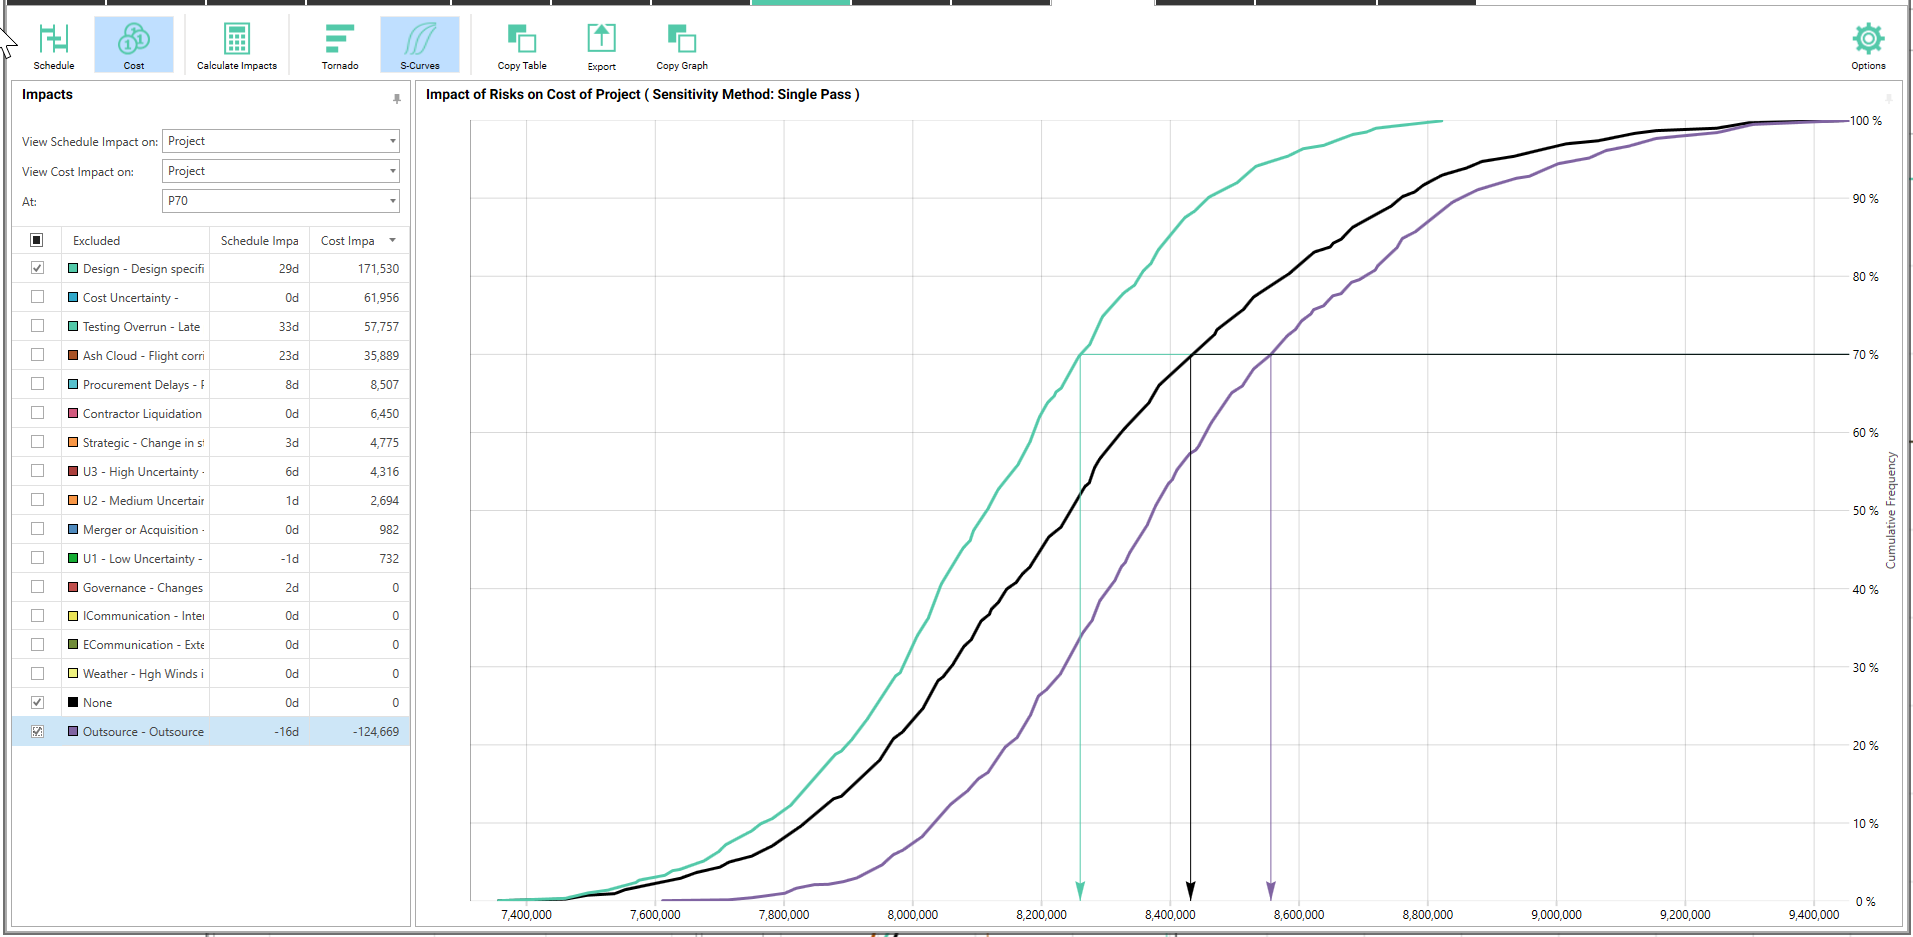
Now we can tell our Project Manager that by removing the Design Specification risk and ensuring that the Outsource opportunity occurs, we can save 49 days and $295k. Note that any costs associated with the mitigation strategies will be included in the model.
About the Author
Ian Nicholson, P.Eng. - VP Solutions
As our VP Solutions and a Lead Risk and Implementation Specialist, Ian leads Emerald’s functional consulting group. With over 20 years of international experience in varied fields and roles from manufacturing, heavy civil construction, pharmaceutical plant construction, hospital projects and oil and gas capital and turnaround projects, Ian brings a wealth of project knowledge to all of our clients.
A visionary in the world of CAPEX, maintenance and turnaround planning processes, Ian has lead many of our large clients through their integration projects between ERP/EAM systems and Primavera products. Some of his integration success stories include Suncor Energy SAP to Primavera integration, BP Maximo to P6 integration, implementation of P6 at the Ontario Power Authority as well as the integration of Primavera Contract Manager with Oracle Financials at Capital Health Authority and Vancouver’s Rapid Transit Project 2000. Other major clients include Milwaukee Metropolitan Sewerage District, Shell Canada and Shell Global Solutions.
Ian has conducted Monte-Carlo risk analysis on CAPEX and turnaround projects for Shell Canada, Suncor Energy, Husky Energy and Bruce Power. He believes that successful Monte Carlo application is a process, not just a tool and has spoken at a number of events on the correct application of risk analysis.
When not assisting clients with their projects, Ian unwinds by riding his BMW motorcycle, listening to music or dragging his kids on long hikes.
