Emerald BI-GanttView
Highlights OverviewPurchasingVideosBlogsVisualize your project data with powerful and effective Gantt charts in Power BI, specifically designed for Oracle P6 teams.
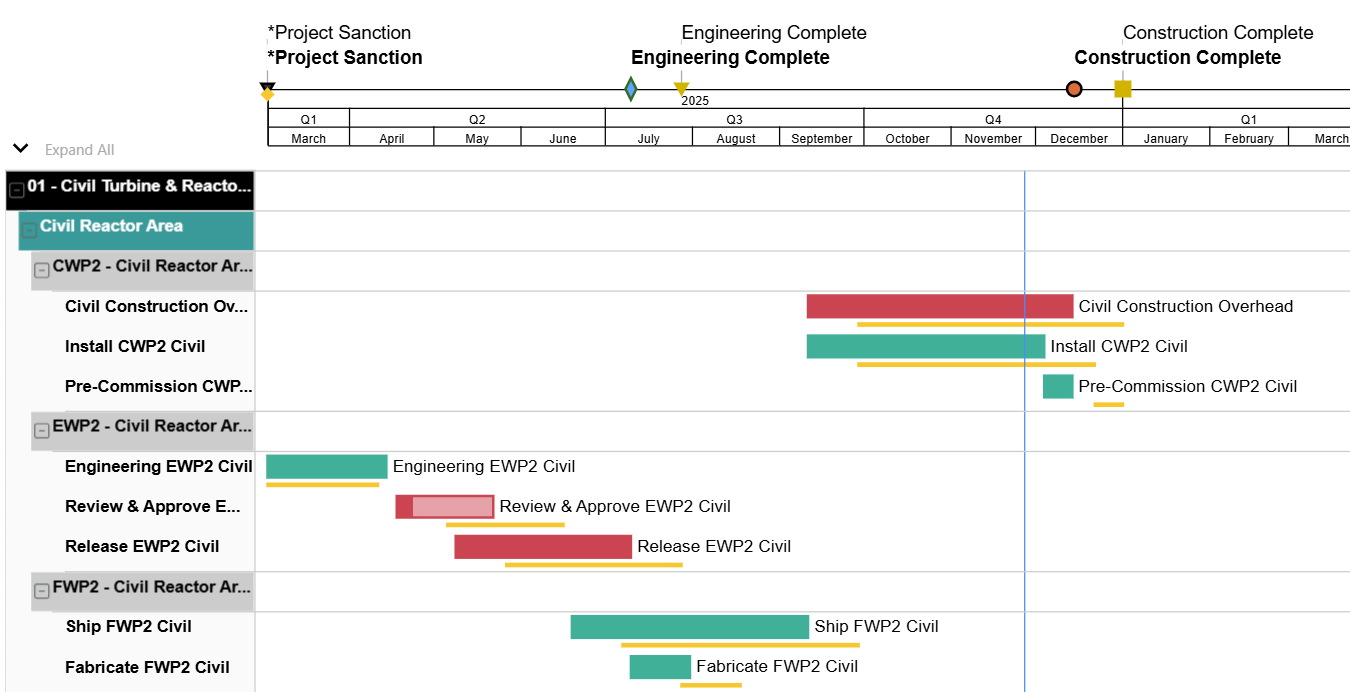
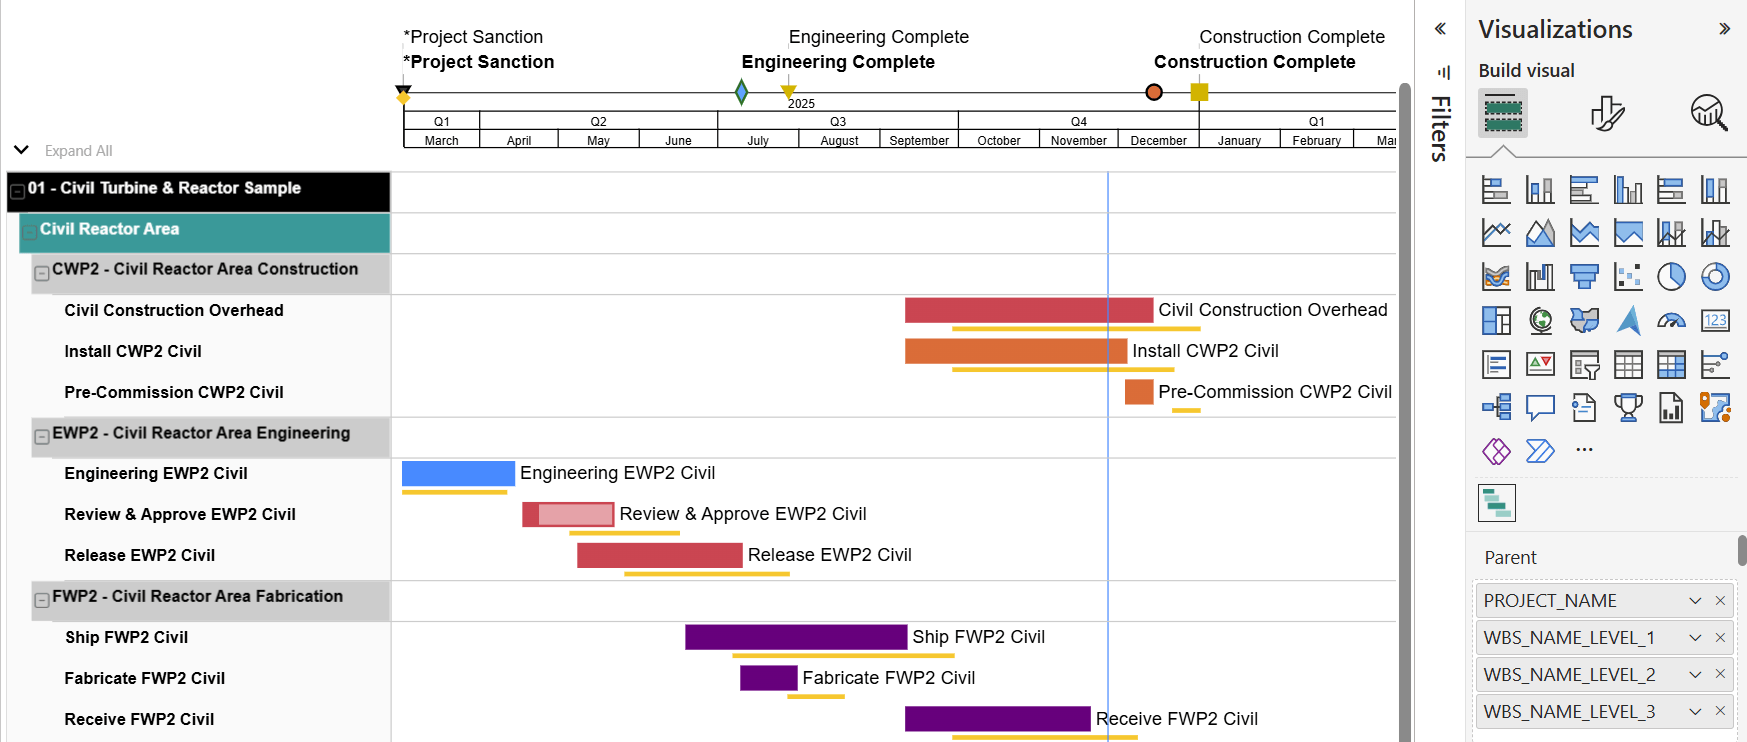
- Top axis milestones - move key milestones to the calendar area for easier management
- Multiple hierarchy levels of grouping to support WBS hierarchy display
- Multiple projects
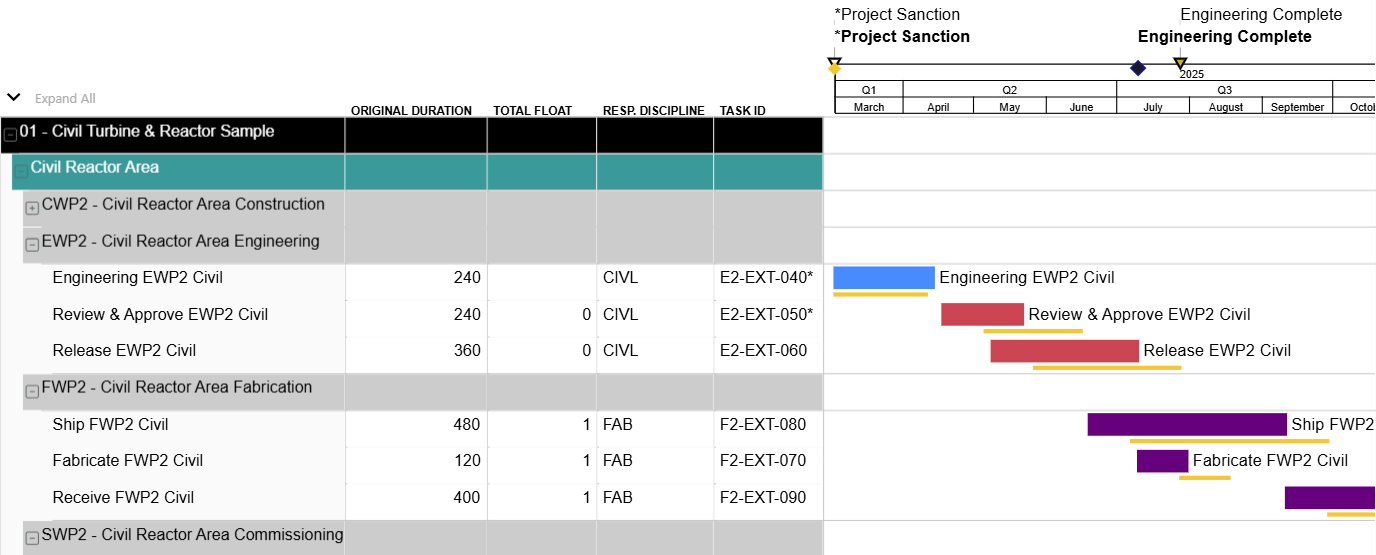
- Multiple columns
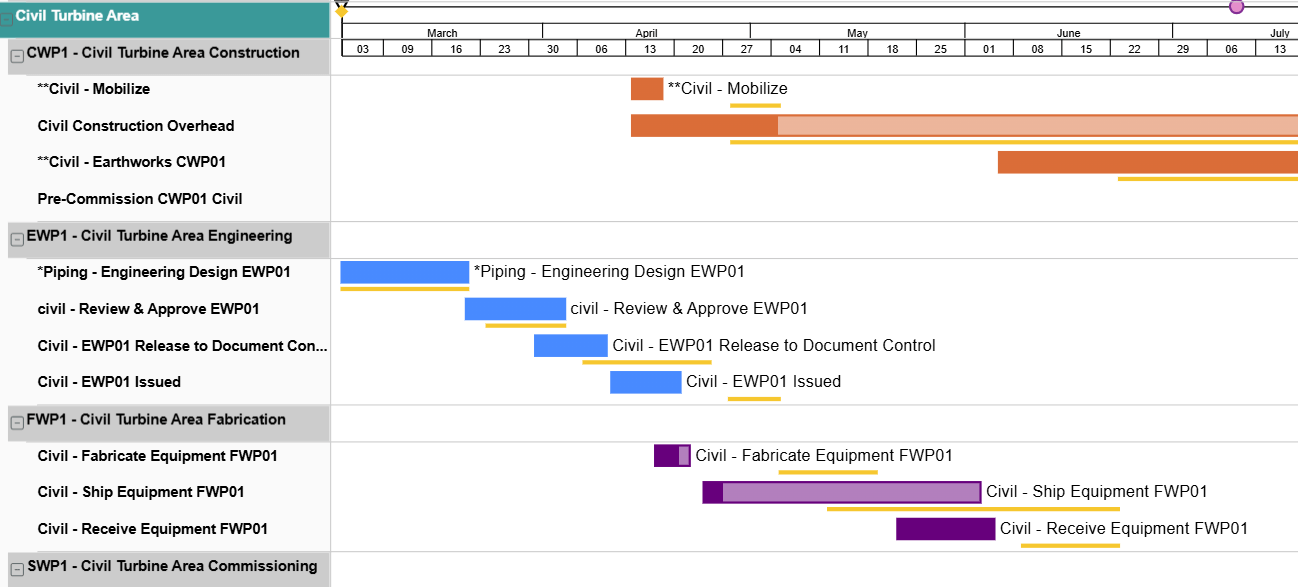
- Gantt bar colour coding for easier identification of responsibility
- Visualize critical tasks directly in Power BI
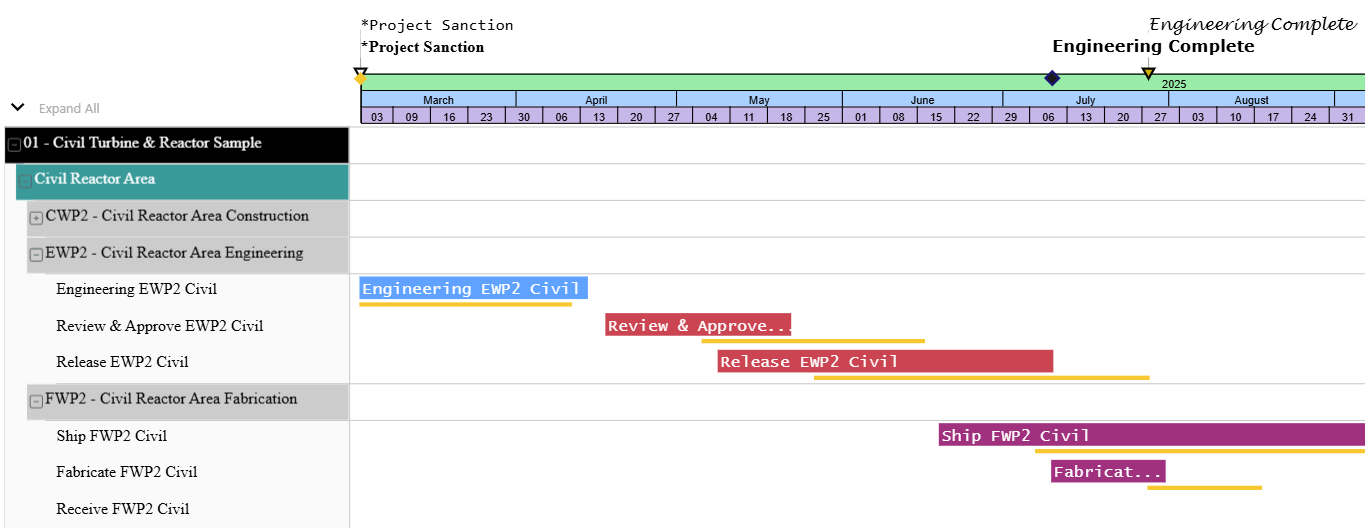
- Three-layer timeline
- Better controls for labels - place text before, inside, or after bars, as well as before or after baselines
- Upcoming feature: Multiple baselines
Latest Version - Highlights
-
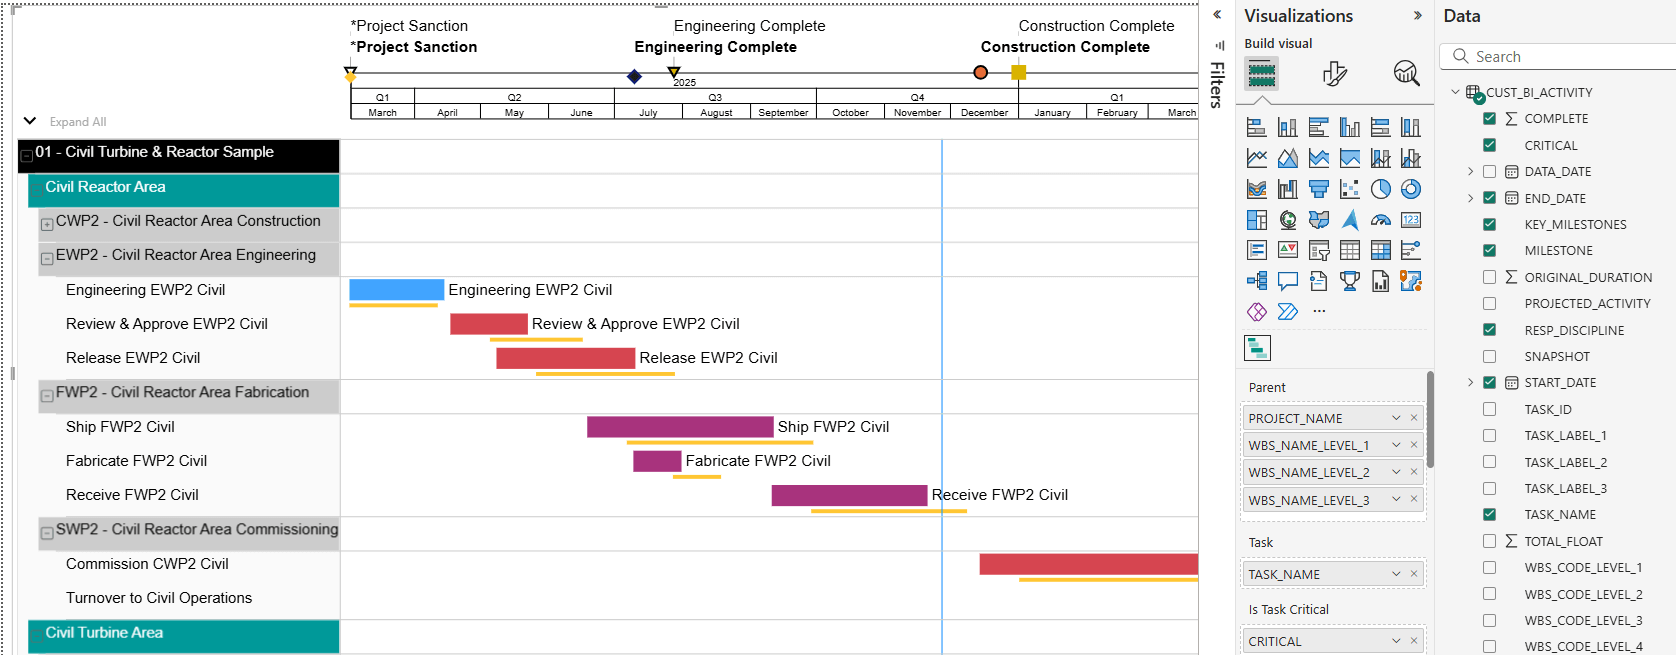
Emerald BI-GanttView lets your team visualize project data with the simple dragging and dropping of different data elements into categories to group your Gantt chart the way you want. This allows the team to decide how to look at the schedule - whether by Work Breakdown Structure, by responsibility, by work type or area of the project, you can target the data for the most flexible and clear visual outputs.
-
Emerald BI-GanttView allows for multiple data columns in the table area, so that you can share important data for each of your activities, laid out neatly and easily digestible for the different team members and project stakeholders.
-
Control the visual outputs in the charts by using labels - left, right, or inside of the bars, with a list of font styles and sizes to choose from. You can also customize the category and milestone labels to make the Gantt charts easier to read.
-
See your project and program milestones along the timeline or within your chart for easy identification. You can also pick from a host of different customization options, including changing milestone shapes, colours, and outlines to clearly communicate deliverables to the project delivery team.
-
With added support for baselines, you can see baselines directly in Power BI and label them as well. You can also see task completion status directly in your chart, represented by the filled portion of the taskbars.
-
Create a 1 to 1 recreation of your WBS hierarchy within Power BI, and color code project bars for easy identification at a glance.


Back to top
Overview
Problem
Building detailed programs and projects in scheduling tools that the team does not all use can make it hard to keep tasks and milestone dates and ongoing changes available in real time. Tools such as Oracle Primavera P6 Enterprise Project Portfolio Management or Microsoft Project are not typically deployed to the whole project team, so the schedule is not used as proactively as it should be to manage key milestones and tasks in real time.
Microsoft Power BI is a powerful tool commonly used for data visualization that can fill the project team dashboarding reporting gap. Gantt charts are an ideal way to understand the flow of activities in your reports, but the current offering of Gantt charts for Power BI lack many of the features you need to communicate your scheduling data.
Solution
Emerald BI-GanttView provides a cleaner, smoother Power BI experience, offering the features you need in order to create effective Gantt charts. Enjoy Gantt charts with increased functionality and better usability, making it easier than ever to see the connections and important deliverables, responsibility, deadlines and progress in your schedule all in a robust dashboard.
What’s more, with Emerald BI-GanttView, powerful and flexible stylings make Gantt charts more customizable and easier to develop, creating clear Gantt charts that your team will want to use. With configurable options for milestone shapes, grouping and sorting, extra data columns, and full Gantt bar controls including colours, borders and different font sizes and styles, you can display your data the way you want it, in the way that makes the most sense to your project team.
Even better, Emerald BI-GanttView can use any data imported into Power BI, regardless of where it’s from, including Oracle P6, Microsoft Project and Microsoft Excel.
ROI
Emerald BI-GanttView allows you to share your detailed scheduling data with your extended team in an easy to use and comprehensive GanttView, so that the project team and management stakeholders can action critical tasks and stay in front of key milestones. This important information is cleanly presented and summarized in targeted Gantt charts, so that you can get the full picture with just a glance.
Purchasing
Purchase BI-Gantt View directly from the Microsoft AppSource Store.Back to top
Videos


Back to top
Blogs

