Milestone Trending
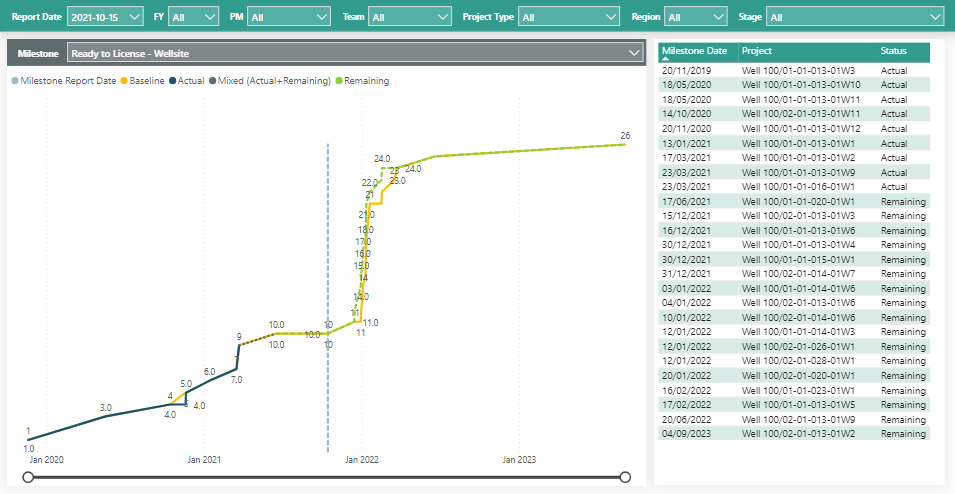
Select any milestone that you would like to view and see how they are trending across all of your projects.
- Right out of the box, our reports will pick up any of the milestones in your projects. When new milestones are added, those will be available too.
- Slice them by Project Manager, Project Type, Fiscal Year - any Primavera P6 code or UDF can be used - P6-Reporter (previously known as EP-datawarehouse) gives you access to all of your Primavera P6 fields so that you can add it to your report.
Side by Side Trending
In the visual below, P6-Reporter captured snapshots of Primavera P6 monthly: these are the values that you can see in the report date. Because the data was stored, it allows us to do comparisons, so you can take the milestones for the current month and see them next to where they were last month, last quarter, or last year.
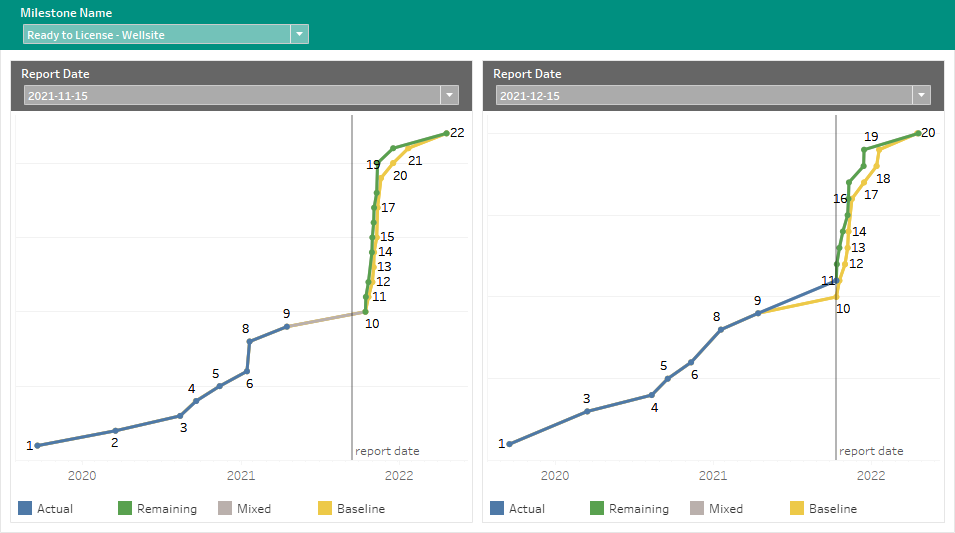
All of the report pages seen on this page are available in both Power BI and Tableau, and using P6-Reporter, can be recreated in any of your preferred reporting tools that are capable of connecting to an Oracle or Microsoft SQL Server database.
