Project Portfolio Dashboard
Also available in Tableau!
Start here for a high level overview of your portfolio and project health, then dive into our Resource Allocation or Project Detail report to analyze the details of what you've found and plan your next steps.
The slicer pane at the top allows you to look at only the projects you want. Perhaps you only want to look at ones on a specific region, or ones overseen by certain project managers. The report quickly adapts to show you only those projects. The report shown here was built using drilling projects as an example, but with P6-Reporter, you can alter the report to filter on any field, code, or UDF you see in P6 at your company. If you don't have experience developing reports, we're also available to customize them for you.
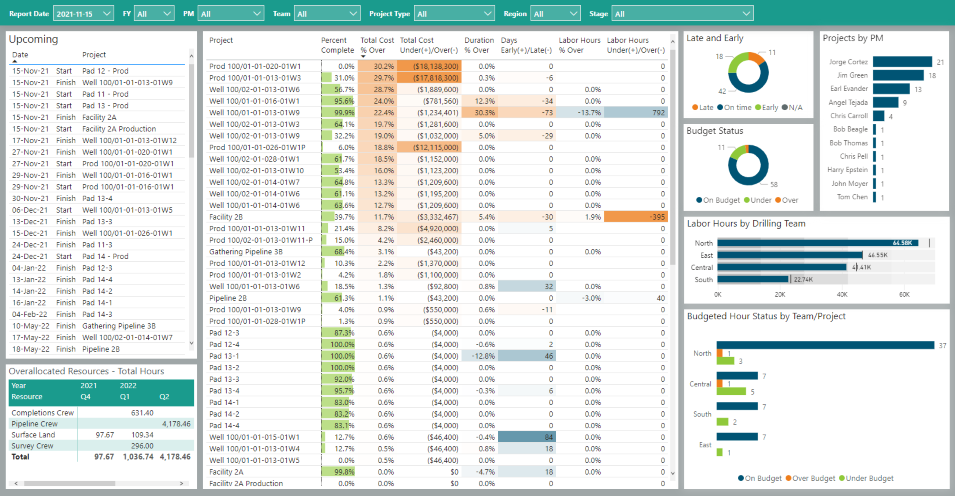
Upcoming Project
The upcoming project list gives you a summary on just that: what projects are starting and finishing and the currently planned date.
Overallocated Resources
Overallocated Resources identifies for you which of your labor resources are overbooked in the current and subsequent quarters. If you want to dive deeper, we have a report section dedicated to resource allocation, that will show you how they're spread out over time, the limit on the number of hours they can be used each day, and a breakdown of the projects that they're used on.
Projects
Our front and center project chart lists each of your projects with the key performance indicators of the project's health: the percent and amount over or under budget, duration, and labour hours. Looking for another KPI? Perhaps the CPI? You can add any metric you'd like, and P6-Reporter makes it easy.
Highlighting on this table makes it easy to spot the projects with issues: the darker a color is, the more over or under the planned value a project is. Orange identifies projects that are over budget, duration, or labor hours, and blue marks ones that are under; which can be handy for making sure you use your planned budget before the end of the year, or to see what projects you could re-allocate crews from.
You can sort this table by simply clicking on any header, so you can order the projects by days late, percent over budget - any metric you'd like.
Late and Early Projects, Budget Status, and Projects by PM
These provide quick and glanceable references, so you can see where your projects are at.
Labor Hours by Drilling Team
The Vertical Lines indicate the planned labor hours for all projects a team is working on combined, and the bars indicate the forecasted at completion hours. As you can see, all of the teams except the east team are under budget. If you're not managing drilling crews, there are many more options for charts that could take the place of this one.
Budgeted Hour Status by Team
A simple and convenient view of how many projects are over, under, or matching their planned labor hours.
