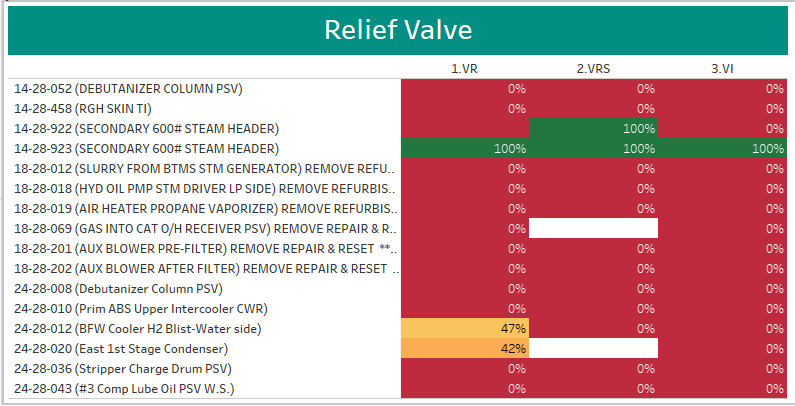
Relief Valve Summary
Easily track progress of Relief Valves during your next Outage or TA. Monitor summary progress to identify any areas of progress concern or missing updates. Generate the graphic report with the latest status information, helping identify any potential areas of concern. Create dashboards, update electronically, and share progress with your team. Focus everyone on the most current updates with a clear view of issues requiring attention. Non P6 users do not have to access P6 or have a report printed for the latest information.
P6-Reporter is a powerful reporting solution designed to make project data from Primavera P6 accessible, visual, and actionable. Developed by Emerald Associates, this tool helps project teams transform complex scheduling and resource information into clear, customizable dashboards and reports.
With P6-Reporter, you can integrate your Primavera P6 data with leading business intelligence platforms such as Microsoft Power BI, Tableau, or Oracle Data Visualization. This integration allows you to build interactive reports that highlight project performance, schedule health, resource allocation, and cost trends. Instead of relying on static reports or time-consuming manual data exports, P6-Reporter provides a dynamic view of your project portfolio.
The solution supports a wide range of reporting needs, from high-level executive dashboards to detailed scheduler and project manager reports. Teams can monitor KPIs, identify risks, and communicate results more effectively with stakeholders. P6-Reporter also offers flexibility to tailor dashboards to match organizational requirements, ensuring that the right people see the right data.
Whether you are overseeing a single project or managing a large portfolio, P6-Reporter helps you to improve visibility, streamline reporting processes, and make better, data-driven decisions across your project lifecycle.
