Resource Allocation
Ensuring that your project has the resources they need when they need them is always on the mind of any good scheduler or project manager. Our reports offer a variety of different ways to understand the state of your resources quickly and easily, so that everyone who needs to be involved can start with a common understanding of where the corrections need to be made.
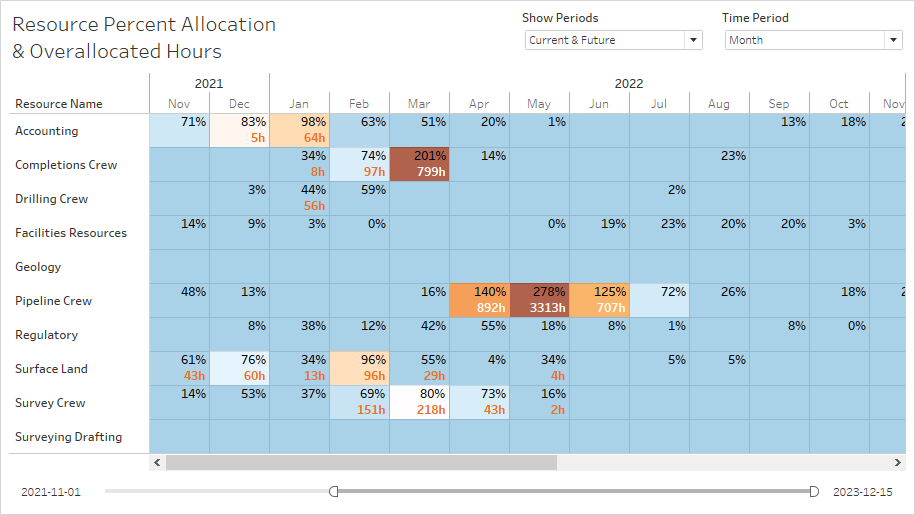
Highlight Table
This visual, which was created in Tableau, allows you to see the percent allocation by day, week, month, or quarter. The number beneath it is the sum of the overallocated hours; it is important to remember that even though a resource may have low allocation percentage, it may still be overallocated on a few days of the month and this visual will help you spot that issue easily.
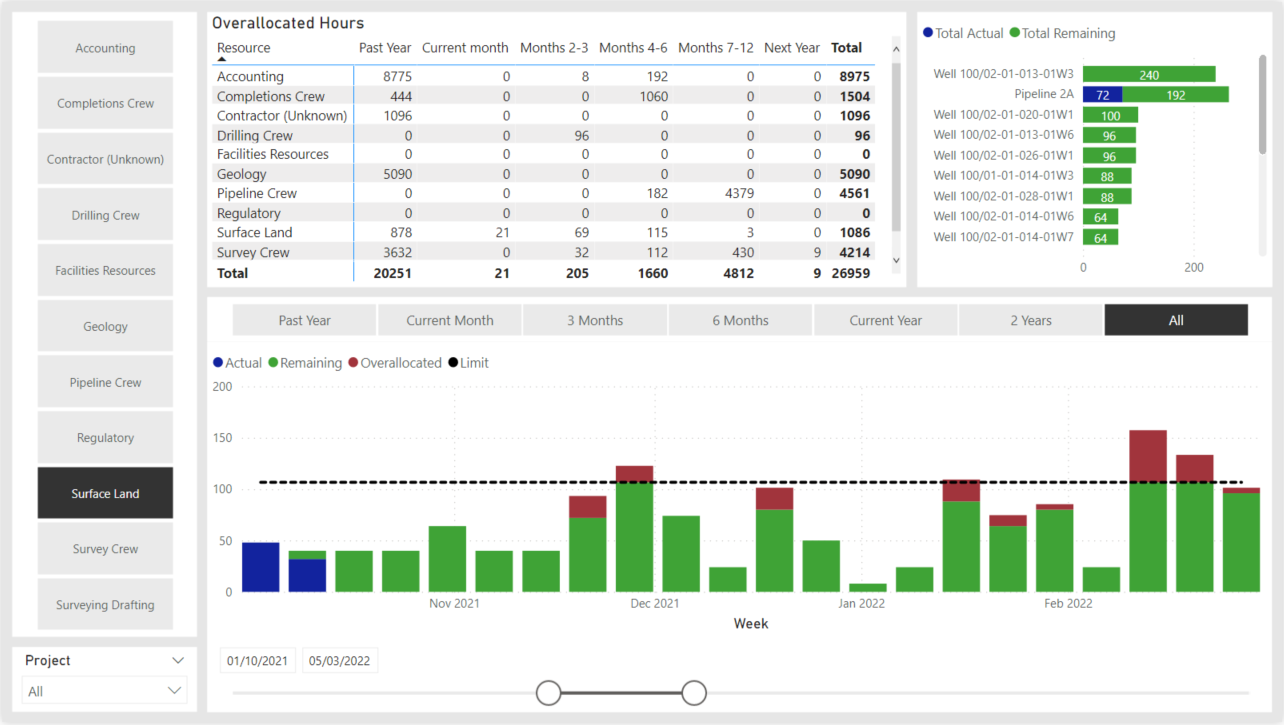
Resource Allocation Dashboard
The Power BI report page below (we also offer versions in Tableau), gives you the familiar Primavera P6 bar chart of resources allocated vs the limit, and without the hassle of logging into Primavera P6. As you interact with it, it also lets you identify which projects are using the selected resource, during the time range chosen by you.