Emerald BI-GanttView Webinar - 2025-08-05
Description
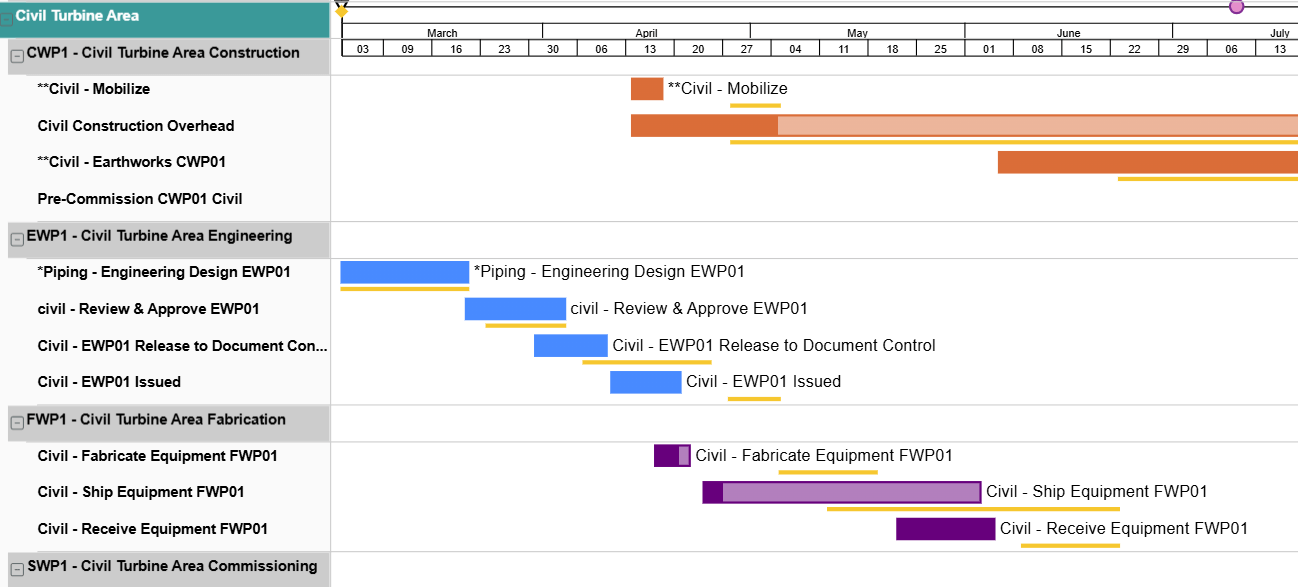
Emerald Associates is excited to announce the release of our new Gantt chart visual tool for Power BI - the Emerald BI-GanttView!
We created this new visual tool to fill the existing gap that we saw in Power BI’s Gantt chart offerings. The Emerald BI-GanttView tool offers extremely configurable charts, with multiple columns, three-layer timelines, improved label control, top axis milestones, multiple hierarchy levels for a full WBS hierarchy display, and more.
Just about everything is configurable, including the shapes and colours of your milestones, font styles and sizes, color coding of activity bars, robust sorting capabilities, increased label control, and much more. You can even display multiple projects, with information presented clearly for non-scheduling team members. The Emerald BI-GanttView can use any data incorporated into Power BI, regardless where it is from, so you can start building your charts from your existing data quickly and efficiently.
Just about everything is configurable, including the shapes and colours of your milestones, font styles and sizes, color coding of activity bars, robust sorting capabilities, increased label control, and much more. You can even display multiple projects, with information presented clearly for non-scheduling team members. The Emerald BI-GanttView can use any data incorporated into Power BI, regardless where it is from, so you can start building your charts from your existing data quickly and efficiently.
In this upcoming webinar, we will be offering our first detailed walk-through of the Emerald BI-GanttView. This will include a general overview of the tool and its capabilities, a demonstration on how to pull data from Oracle Primavera P6 into Microsoft Power BI for Emerald BI-GanttView to work with, and an example of some typical reports that can be created from this process.
Don’t miss out - register today!
Don’t miss out - register today!
