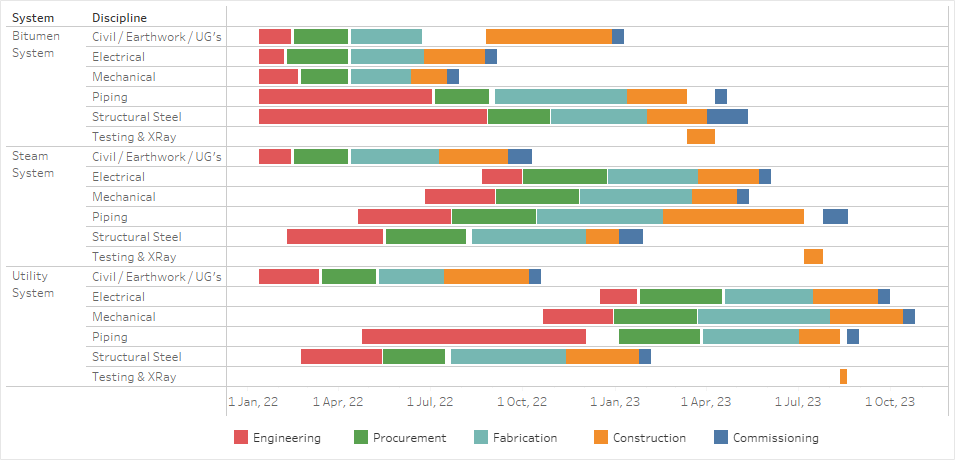
Racetrack
This Racetrack Diagram, done in Tableau, allows users to quickly pull summary level project data into a visual format that is easy to control and consume. This enables the team to identify potential bottlenecks by analyzing work overlaps and area congestion which results in the ability to make informed decisions regarding project timelines.
P6-Reporter is a powerful reporting solution designed to make project data from Primavera P6 accessible, visual, and actionable. Developed by Emerald Associates, this tool helps project teams transform complex scheduling and resource information into clear, customizable dashboards and reports.
With P6-Reporter, you can integrate your Primavera P6 data with leading business intelligence platforms such as Microsoft Power BI, Tableau, or Oracle Data Visualization. This integration allows you to build interactive reports that highlight project performance, schedule health, resource allocation, and cost trends. Instead of relying on static reports or time-consuming manual data exports, P6-Reporter provides a dynamic view of your project portfolio.
The solution supports a wide range of reporting needs, from high-level executive dashboards to detailed scheduler and project manager reports. Teams can monitor KPIs, identify risks, and communicate results more effectively with stakeholders. P6-Reporter also offers flexibility to tailor dashboards to match organizational requirements, ensuring that the right people see the right data.
Whether you are overseeing a single project or managing a large portfolio, P6-Reporter helps you to improve visibility, streamline reporting processes, and make better, data-driven decisions across your project lifecycle.
