P6-Reporter v3 - New Release
More charts. More insight. Understand your projects in ready to use, customizable reports in Power BI, Tableau or ODV.

February 14, 2022
More charts. More insight. Understand your projects in ready to use, customizable reports in Power BI, Tableau or ODV.
New Features
-
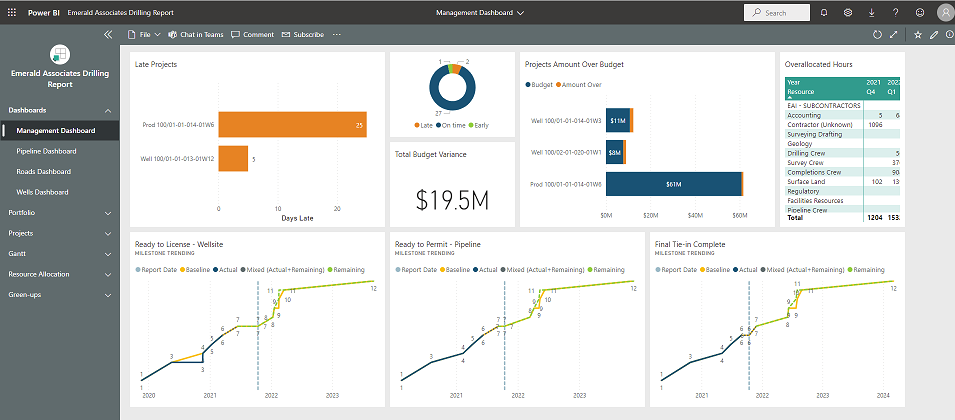
New charts for resource allocation - see at a glance which resources are overallocated, then select a resource to see which dates are affected, which projects are using it, and how much float you have in each.
-
Gantt charts - select a resource and view how it is allocated across a series of projects.
-
Milestone Trending - see any of your milestones across your portfolio: where they're planned to be, where they are now, and if they're behind, how quickly you can expect to get caught up.
Enhancements
-
Green-ups are now expandable. Want to know the percent completion for each activity in a category and not just the category itself? Now you can.
-
More trending! Is your project headed in the right direction? Perhaps you've had a major setback and are getting caught-up, or perhaps you're falling steadily behind. Looking at current numbers only tells half the story. P6-Reporter reports are the only way to see where your Primavera P6 projects have been so that you can tell where they are going. In here you'll find trending information for all costs, finish date and duration variances, as well as CPI and SPI over the course of your project.
