Who this is for: Teams running Primavera P6 software with project data generated by P6-Reporter and stored in a self-hosted Oracle database, who want to light up Power BI—and now also Microsoft Fabric—without re-platforming their core systems.
Written by Max Wang - Integration Specialist
on Tuesday, 25 November 2025.
Posted in P6-Reporter
Project issues can be very disruptive and expensive. In executing projects, issues can (and most often do) arise at various points. Having a good set of project control procedures and monitoring what processes are in place enables your team to identify issues and act quickly. Meanwhile, creating mitigation plans based on current, correct information is a must. Making decisions based on old data will not set your project and team up for success, and having your team endure long wait times to retrieve, assemble, and analyze current project information when you’re waiting for decisions to be made is not an effective approach either.
If your team’s struggling with time-consuming manual updates, there are tools that can help you automate the process. Emerald’s
P6-Loader allows you to use Excel-based update sheets to load updates into your progress file. Another one of our tools,
TAPS, facilitates updating P6 using activity barcodes (TAPS Classic) or process updates using TAPS Mobile from your phone. These tools make it quick and painless to get accurate updates into your P6 files. Your team will then have more time for analyzing your schedule instead of wasting time with tedious updating.
Written by Mary Lynn Backstrom, PMP, PMI-SP, PMI-BA – Implementation Specialist
on Tuesday, 17 October 2023.
Posted in All Articles, P6-Reporter
There are many approaches to creating reports from your P6 data, and while free always sounds like the right price, we all know that you get what you pay for. Before you choose an approach, you owe it to yourself to fully assess its strengths and weaknesses. In this article, we’ll compare reporting using XER files versus our own tool: P6-Reporter.
Written by James Andrade - Integration Specialist
on Sunday, 09 April 2023.
Posted in All Articles, P6-Reporter
In executing any type of project, whether it’s a turnaround, construction, manufacturing or other project type, they all benefit from access to quick and current reporting in an easy to digest format. This not only improves project reporting but project communication as well, keeping the team up-to-date with project progress and any issues. With access to self-serve dashboard reporting, the user can easily filter to display the exact data they need to focus on. To deliver reporting for your projects, a reporting tool that is quick to deploy and offers a number of standard reports makes roll out easy. The tool should allow you to produce reports easily on spread data as well, which allows you to compare forecasts captured at different points in time. P6-Reporter offers all of this and more.
Written by Mary Lynn Backstrom, PMP, PMI-SP, PMI-BA – Implementation Specialist
on Friday, 24 March 2023.
Posted in All Articles, P6-Reporter
Green up reports can be configured on the specifics required by your project. By using P6-Reporter self-serve dashboards, you and your project teams can have current, easy to digest project information including overall status and highlights for issues requiring immediate attention. Keep in mind that the green up dashboard examples below are meant as food for thought. These examples may be reflecting exactly the items you need to track in your project(s), or you may need to track entirely different elements. Green up reports can be created for the specifics your project teams require whether it is easily tracking manufacturing stages, distribution status, inventory completion status, machine service cycle completions…the list goes on. A green up report can be configured to track many different schedule items.
Written by Mary Lynn Backstrom, PMP, PMI-SP, PMI-BA – Implementation Specialist
on Friday, 24 February 2023.
Posted in All Articles, P6-Reporter
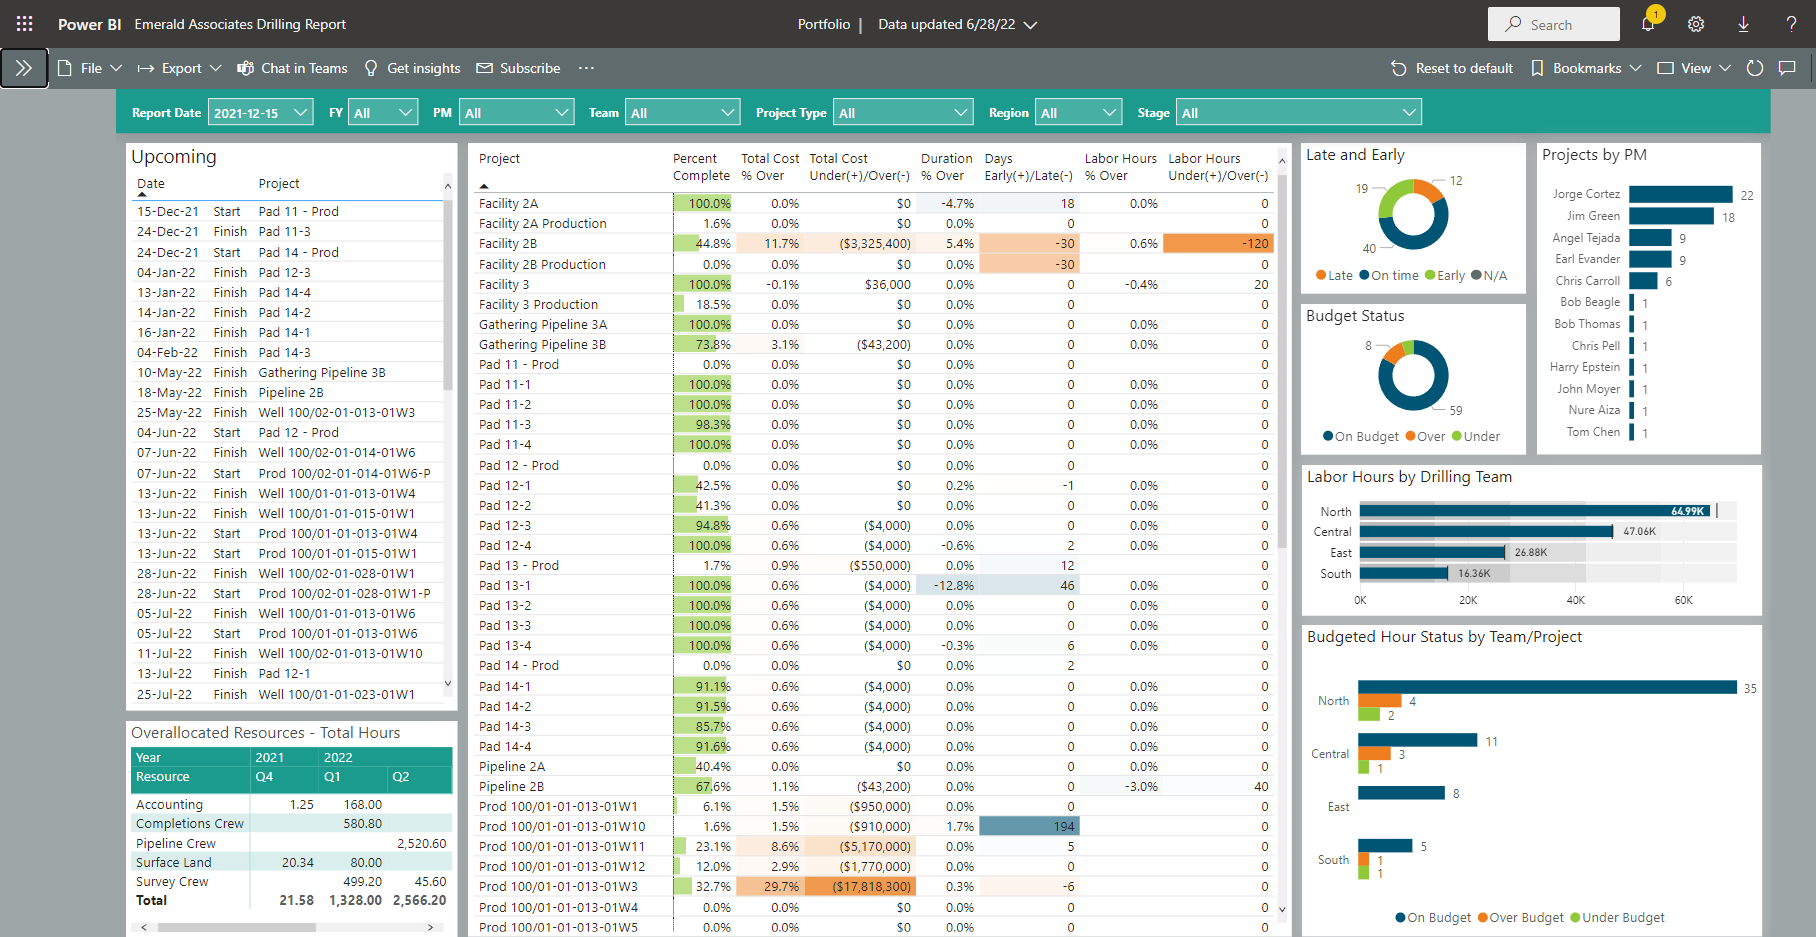
Above is an example of a Portfolio Dashboard available in P6-Reporter that is displayed using Power BI. Self-serve dashboards provide easy access to data in a very easy to digest format. Notice the gradient color coding in these Portfolio screen shots that help focus on issues quickly. Easily re-sort column data by simply clicking on the column headers. Select graph elements and the column elements that are connected to it automatically filter to highlight on the dashboard. (see below)
Written by Mary Lynn Backstrom, PMP, PMI-SP, PMI-BA – Implementation Specialist
on Friday, 17 February 2023.
Posted in All Articles, P6-Reporter
Your project schedule will be created in P6, and you are looking to provide the best schedule tools for your project team. What can you add to your team tool kit to assist the project team, address building the schedule, monitor schedule quality, utilize options for updating the schedule and make reporting quick and easy? Let’s look at a few examples for some food for thought.
Written by Mary Lynn Backstrom, PMP, PMI-SP, PMI-BA – Implementation Specialist
on Friday, 10 February 2023.
Posted in All Articles, P6-Loader, P6-QA, P6-Reporter, TAPS
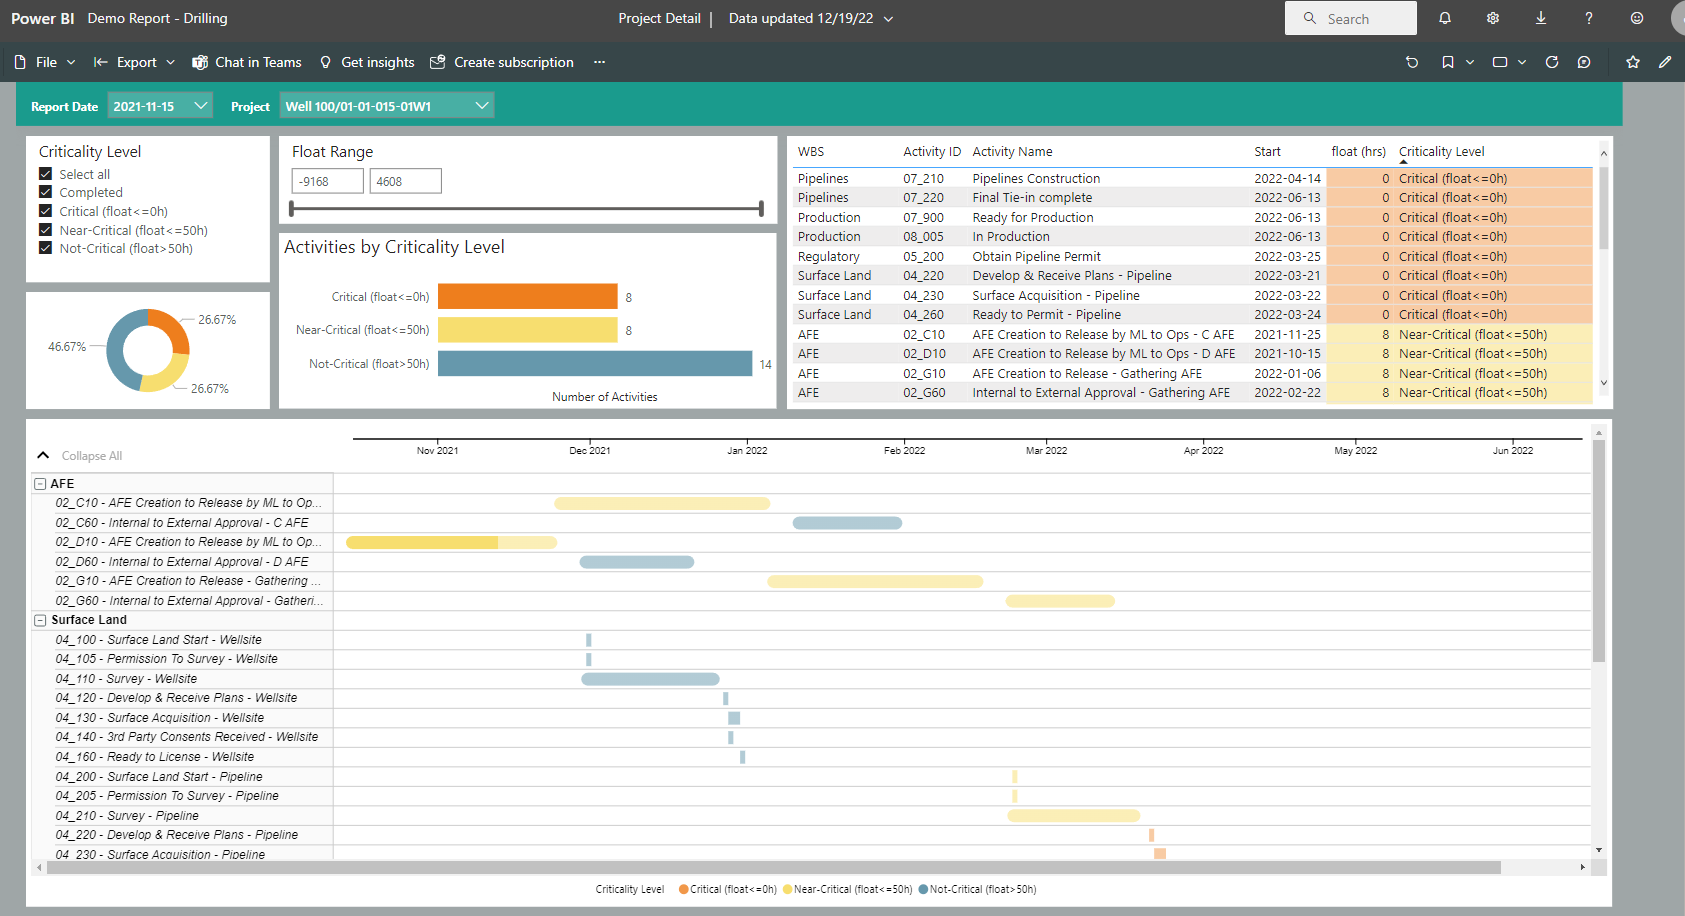
Do you have project critical path status information at your fingertips? Your project teams need current criticality information to make timely, informed project decisions. Delayed decisions or basing decisions on old information can be costly to your projects.
Using the new criticality report now available with P6-Reporter, the current criticality information will always be at your fingertips. Use the filters to choose the file and snapshot required. Keep in mind, the snapshot process can be carried out manually or be automated.
Written by Mary Lynn Backstrom, PMP, PMI-SP, PMI-BA – Implementation Specialist
on Friday, 27 January 2023.
Posted in All Articles, P6-Reporter
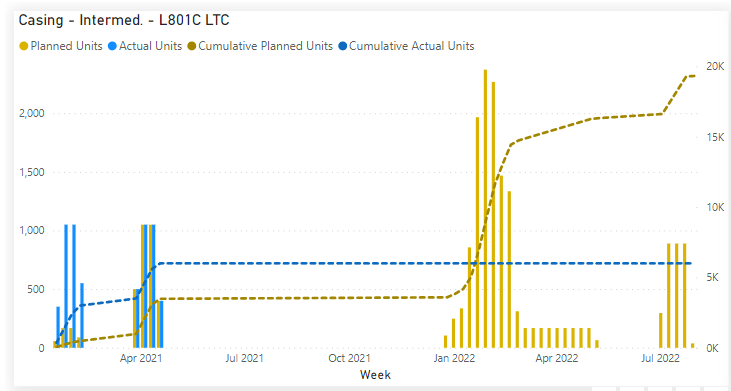
Can you readily monitor commodities on your P6 projects? For example, if your business is oil and gas, can you readily track the requirements of casing or the production levels of oil? For tracking your projects, consider self-serve dashboards for your portfolio of projects.
Written by Mary Lynn Backstrom, PMP, PMI-SP, PMI-BA – Implementation Specialist
on Monday, 09 January 2023.
Posted in All Articles, P6-Reporter
How are you reporting summary progress information on your project? For example, how are you tracking and reporting inspections? Does your team have access to Valve, Exchanger or Piping Summaries in their project reporting dashboards? Provide your team access to easy to digest status reports on progress specifics on your project that are updated using automated snapshots in P6-Reporter (previously EP-datawarehouse). The added information availability is not an extra task that your team needs to spend time on. Once the regular updates to your schedule are completed/reviewed/analyzed, a snapshot of the project is taken. The snapshot process can be automated or you can do it manually if you prefer. The snapshot provides the current information to P6-Reporter dashboard reports. The information the dashboard user views are the latest available from the snapshots. Have regular snapshots of your projects to feed dashboard reports which work to streamline the reporting process. This ensures all team members have access to the most current information with no printing and/or emailing of the reports required for distribution. Previous snapshots are available for easy access if required in P6-Reporter self-serve dashboards; just change the Report date in the drop down menu. Below are some examples of Summary reports displayed in Tableau. Similar reports can be displayed using ODV and Power BI as well.
Written by Mary Lynn Backstrom, PMP, PMI-SP, PMI-BA – Implementation Specialist
on Wednesday, 28 December 2022.
Posted in All Articles, P6-Reporter
Whether it is inspections, pressure safety valves, piping or other elements you are tracking in your P6 Schedule, you can use P6-Reporter Green Up reports which are easily created and maintained right from your P6 schedule. That is correct - no separate spreadsheets required!
Written by Mary Lynn Backstrom, PMP, PMI-SP, PMI-BA – Implementation Specialist
on Sunday, 11 December 2022.
Posted in All Articles, P6-Reporter
Access your self-serve Project Detail Dashboard for easy to digest project information (displayed below in Tableau). Just choose the project and snapshot you want to view using the filters at the top left corner of the dashboard. The project displayed in the dashboard below is a drilling project. This example is food for thought on reporting options available for your projects.
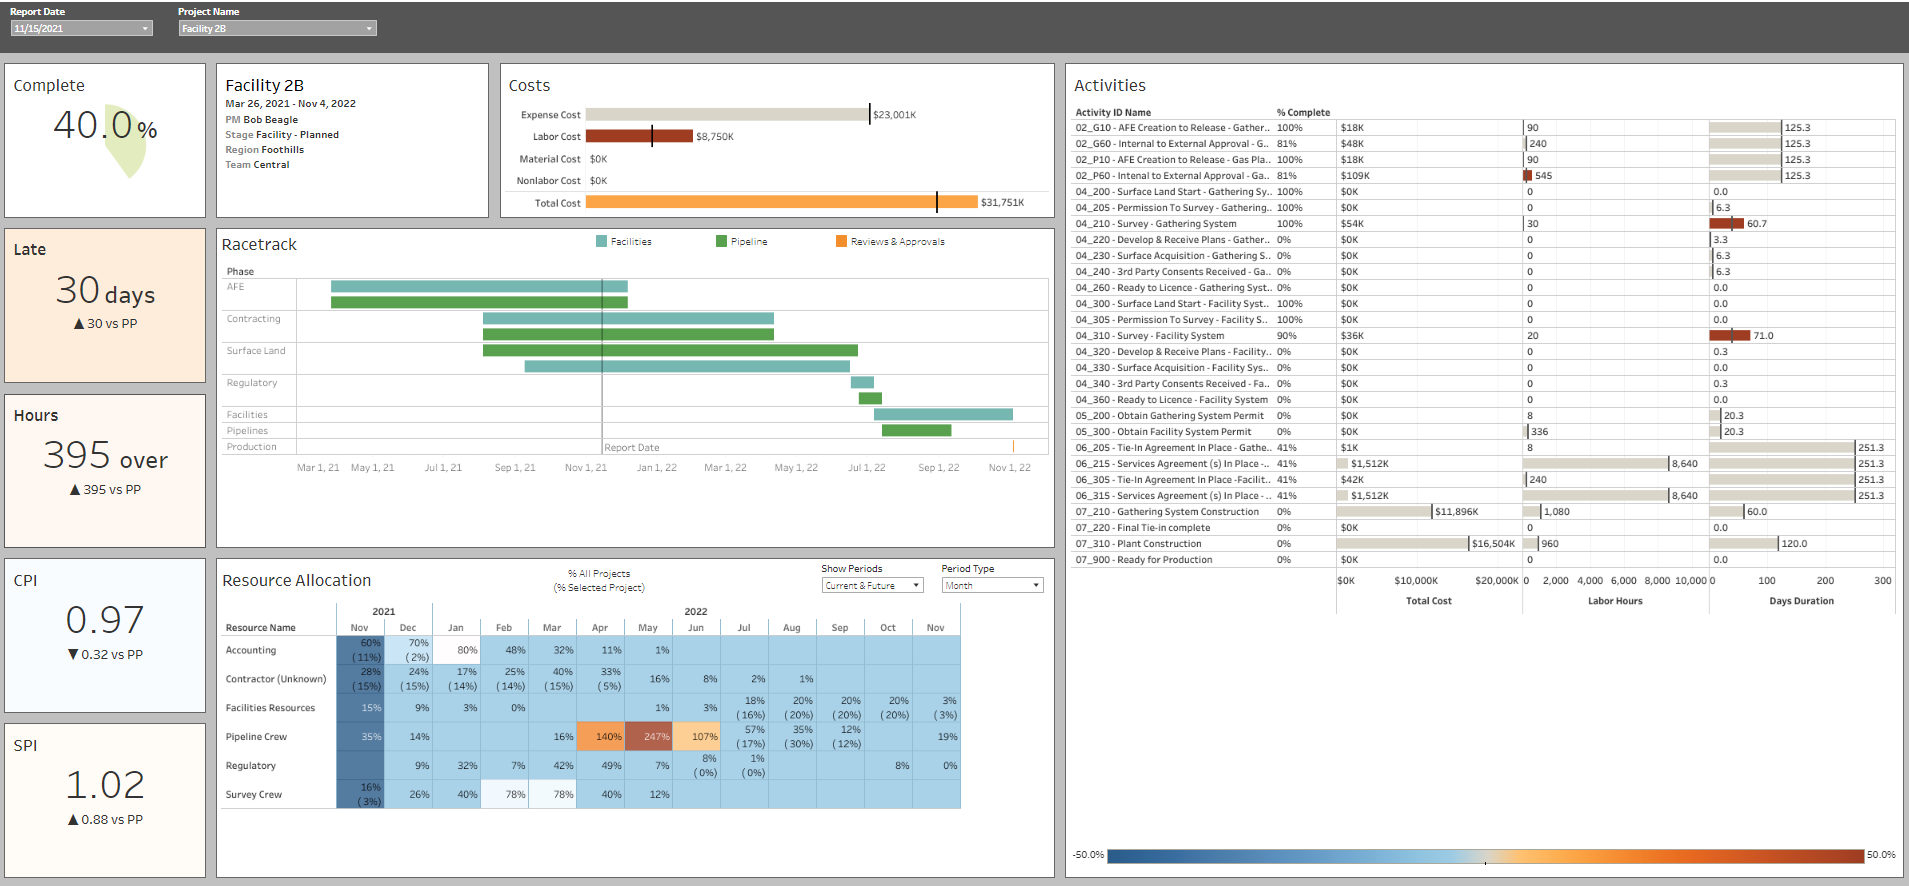
Written by Mary Lynn Backstrom, PMP, PMI-SP, PMI-BA – Implementation Specialist
on Sunday, 27 November 2022.
Posted in All Articles, P6-Reporter
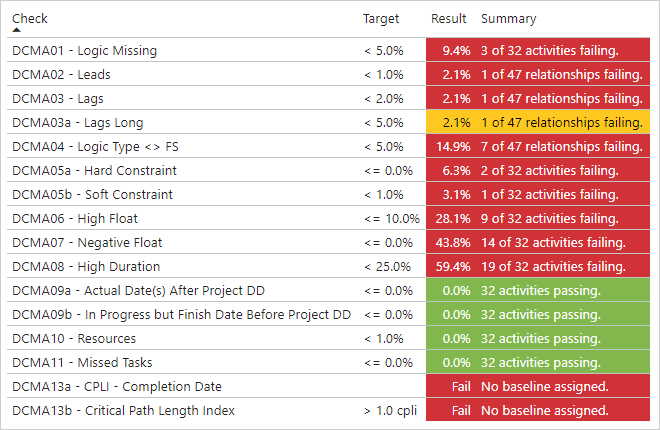
Your P6-QA metrics are now available in Power BI reports. You can also create custom reports via our P6-Reporter tool.
Written by James Andrade - Integration Specialist
on Monday, 21 November 2022.
Posted in All Articles, P6-QA, P6-Reporter
Often we need to compare and analyze multiple scenarios for our projects. Using P6-Reporter (previously EP-datawarehouse), we can store a snapshot of each scenario. These snapshots can be compared directly using P6-Reporter. The user can compare assignments as well as costs. Let’s have a look at an example of rig assignment scenario comparisons. Utilizing P6 scheduling functionality, build the scenarios in P6. Once the scenarios are created, create snapshots of the scenarios in P6-Reporter.
Written by Mary Lynn Backstrom, PMP, PMI-SP, PMI-BA – Implementation Specialist
on Monday, 24 October 2022.
Posted in All Articles, P6-Reporter
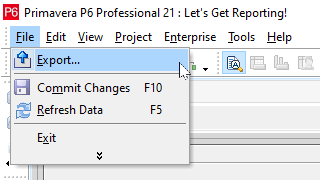
Taking snapshots can be an automated process, but you can create them manually as well. Creating a snapshot manually is easy to accomplish.
Complete the required updates in your P6 schedule and then create a snapshot.
To create the snapshot, go to the projects tab in P6 and set the 'P6R - Snapshot - Period' (previously 'EP-dw – Snapshot – Period’) and the 'P6R - Snapshot - Run' (previously ‘EP-dw – Snapshot – Run’) fields.
Written by Mary Lynn Backstrom, PMP, PMI-SP, PMI-BA – Implementation Specialist
on Sunday, 16 October 2022.
Posted in All Articles, P6-Reporter
