Why P6-Reporter?
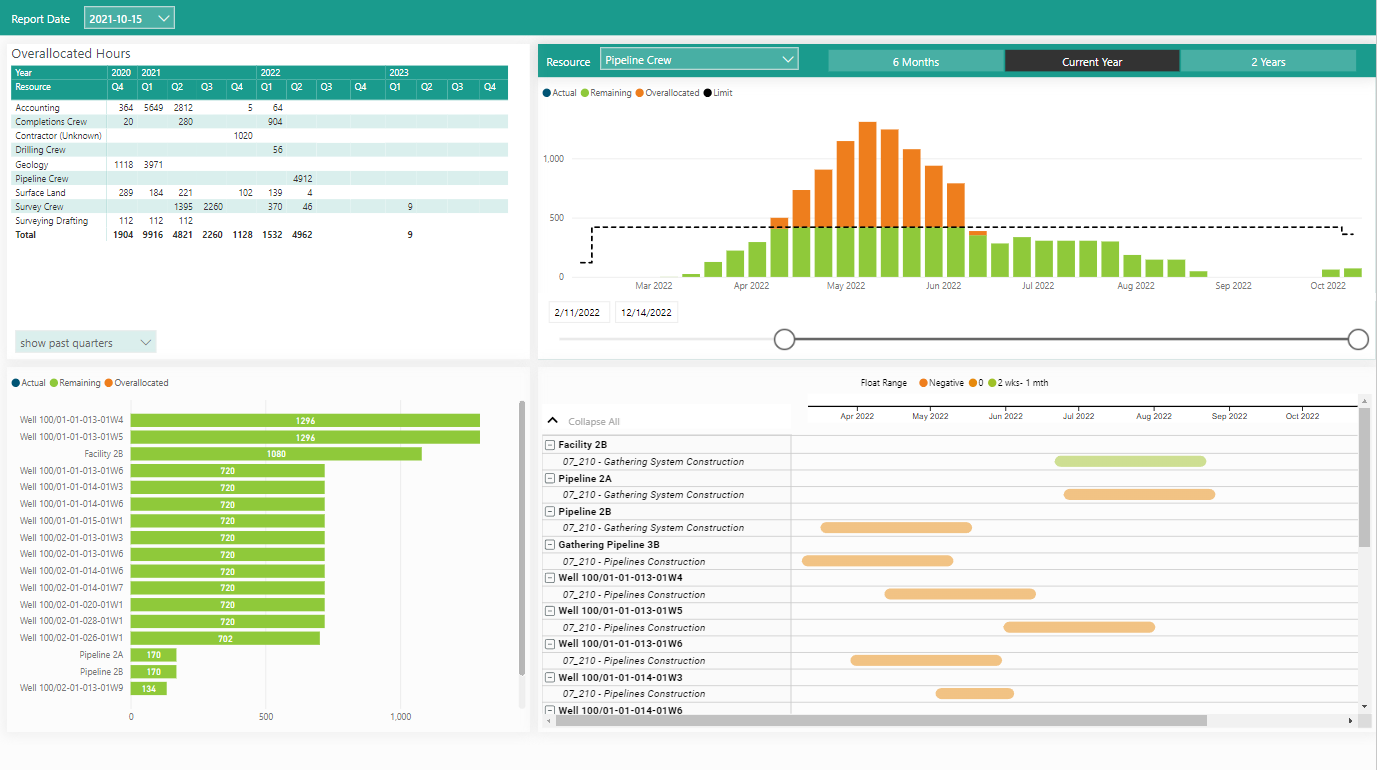
Compare snapshot information focusing on the specific information you require, portfolio or project level. You can compare resource profiles snapshot to snapshot with ease. The example below displays the resource snapshot information from the October snapshot of this project portfolio. Within the dashboard, the user can change the specifics of the display to focus on the information they require.
Portfolio level:
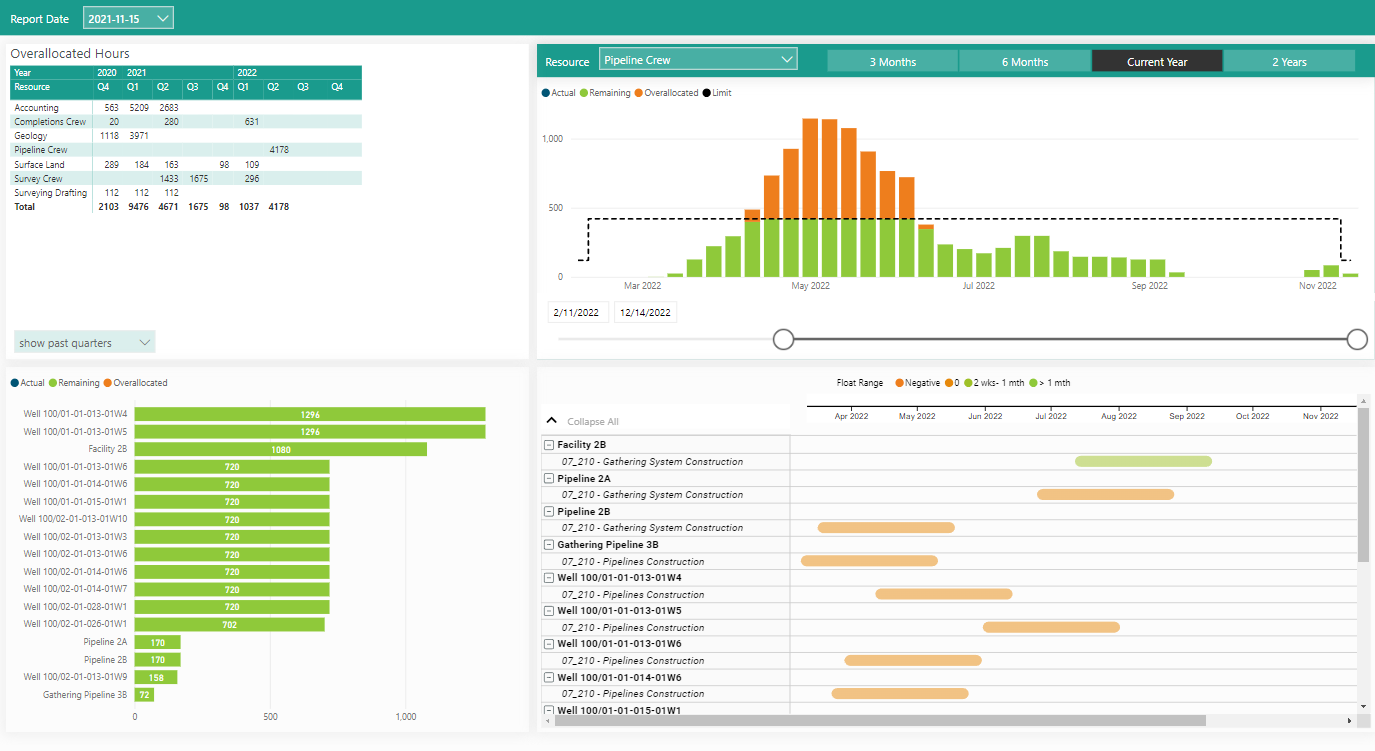
The example below displays the resource snapshot information from the November snapshot for this project portfolio.
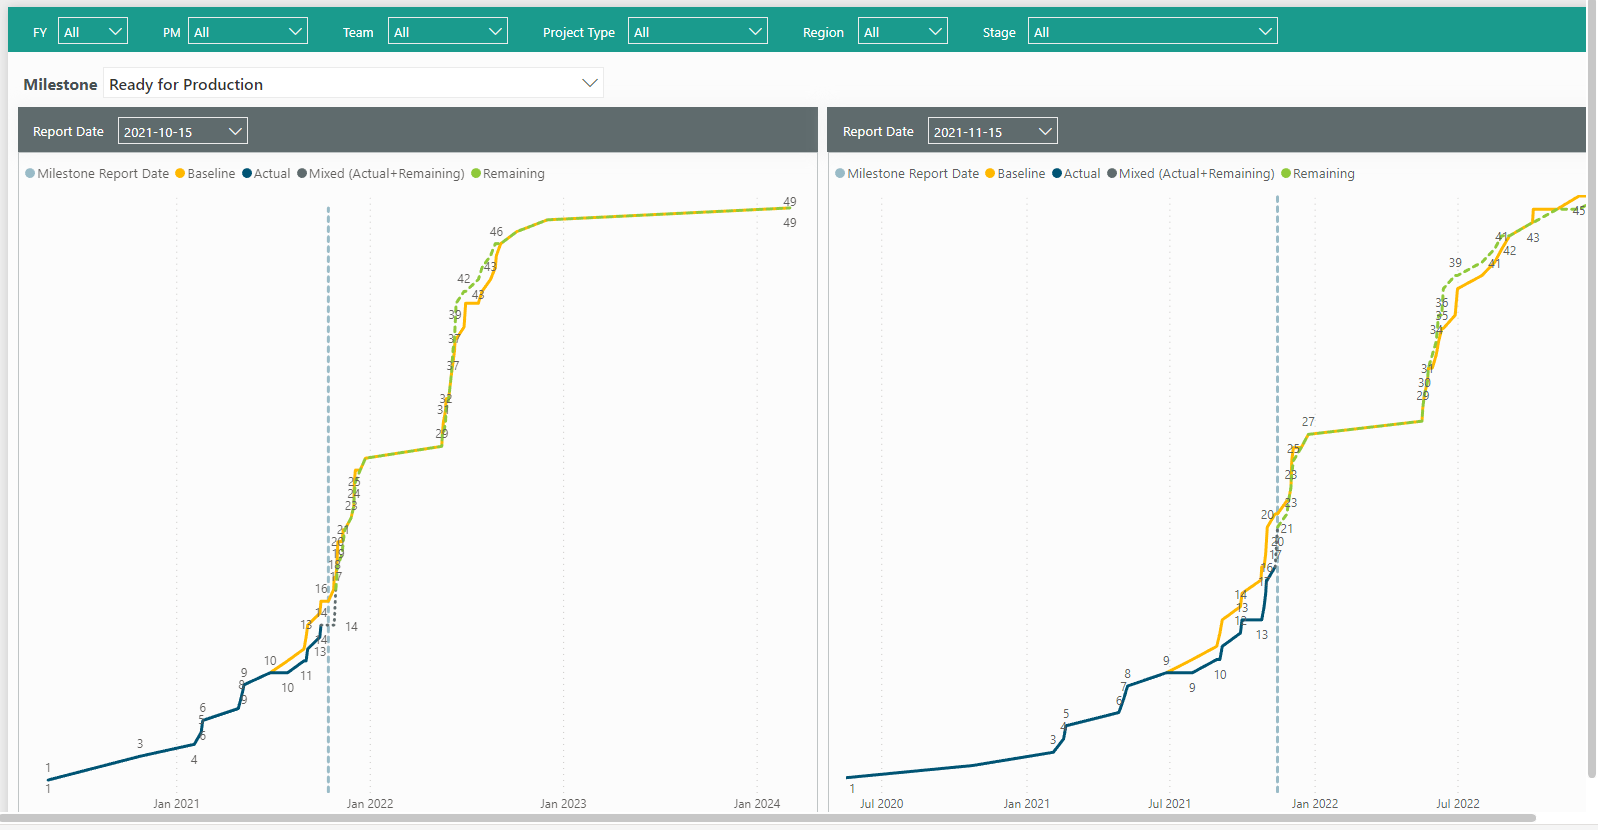
Side-by-side comparison of milestone types at your fingertips. In the example below, ‘Ready for Production’ milestones, is a direct comparison of the milestones in the October snapshot to the November snapshot. Use the filters to focus on the specifics you require.
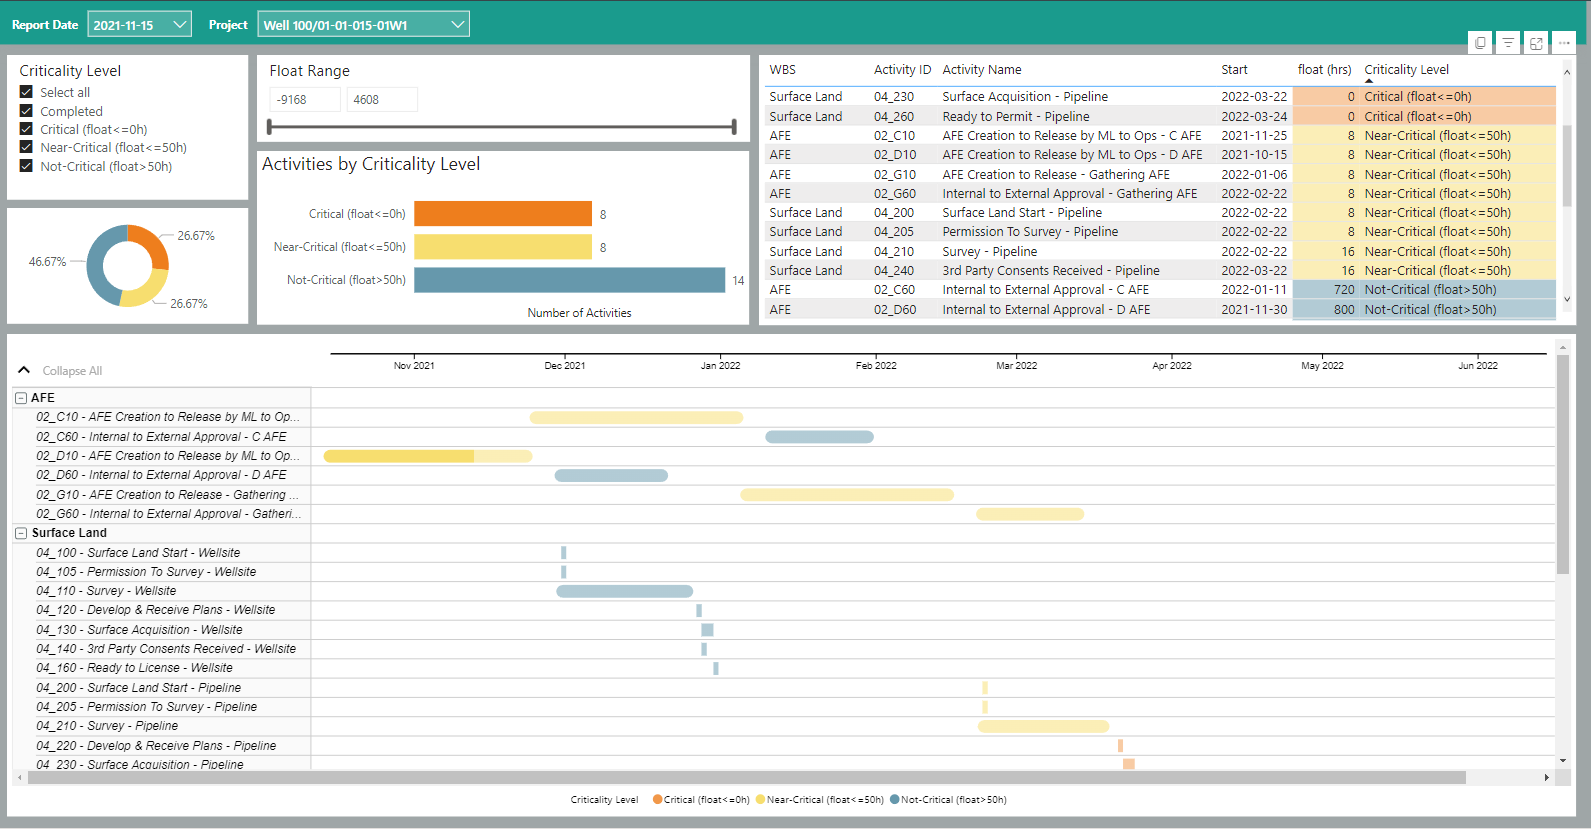
Project level reports, additional food for thought:
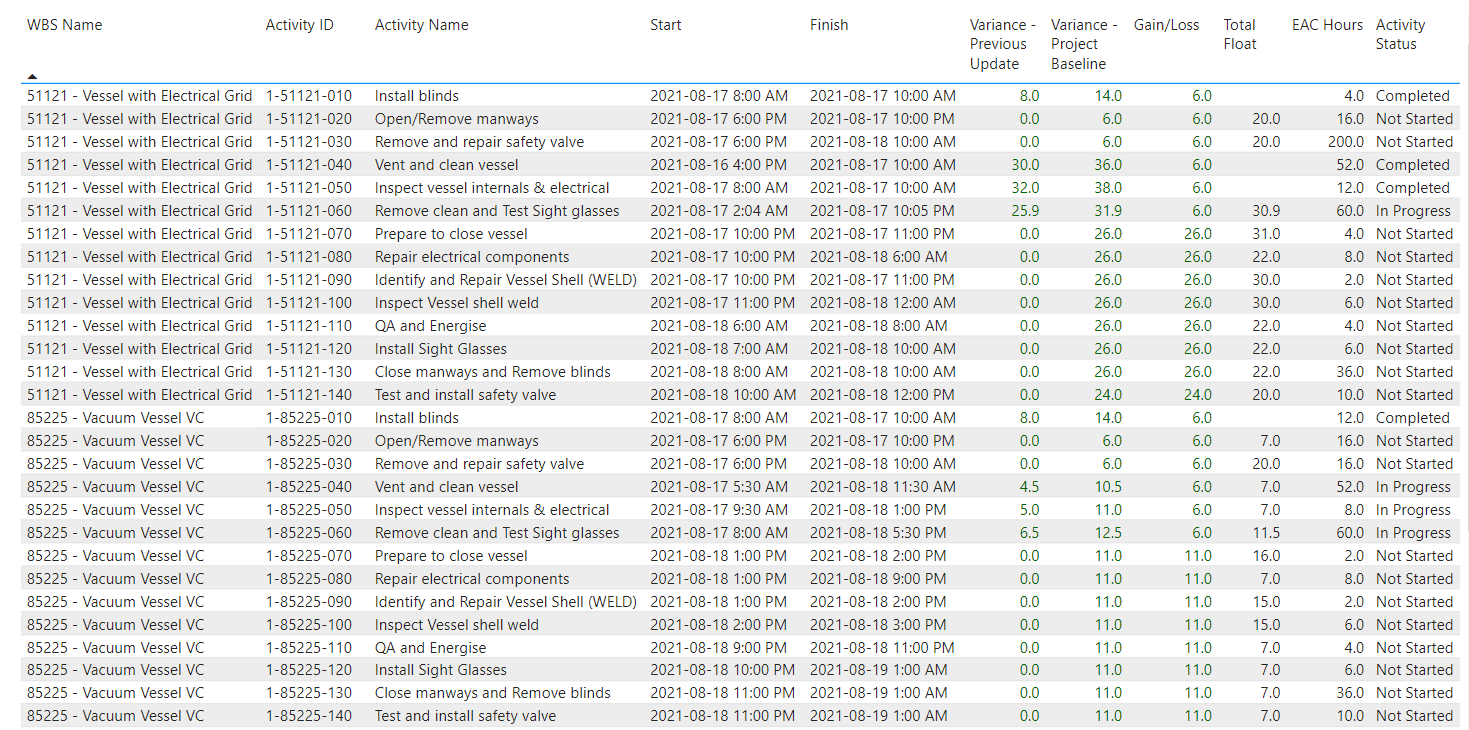
Comparison to Previous Update – Table Report
Project Critical Path Dashboard
These examples are food for thought. Implement the reports and parameters most useful for monitoring your projects with P6-Reporter and easily make them available to your project team. Keep in mind, your team has access to all snapshot information so comparison reports and revisiting previous timeframe reports is available to improve project decisions.
About the Author
Mary Lynn Backstrom, PMP, PMI-SP, PMI-BA – Implementation Specialist
Mary Lynn spent many years filling a variety of project controls duties such as planning, scheduling, analyzing, training and continuous improvement in the Aerospace Industry. Since joining Emerald in 2008, she has been a tremendous asset to the Emerald team. She has worked as a lead scheduler for turnarounds, led sessions for review and troubleshooting of scheduling and reporting, created and given custom training courses for clients, and is a sought after Primavera P6 trainer.
Mary Lynn enjoys some very diverse spare time activities. Along with a variety of outdoor activities such as gardening, she also enjoys making life size lawn ornaments for special holidays like Christmas. Mary Lynn is known for her participation in the community as well. You may have seen her walking in fundraisers in Edmonton and Calgary for the Cancer Society.
