P6-Reporter - Streamline Communication and Reporting
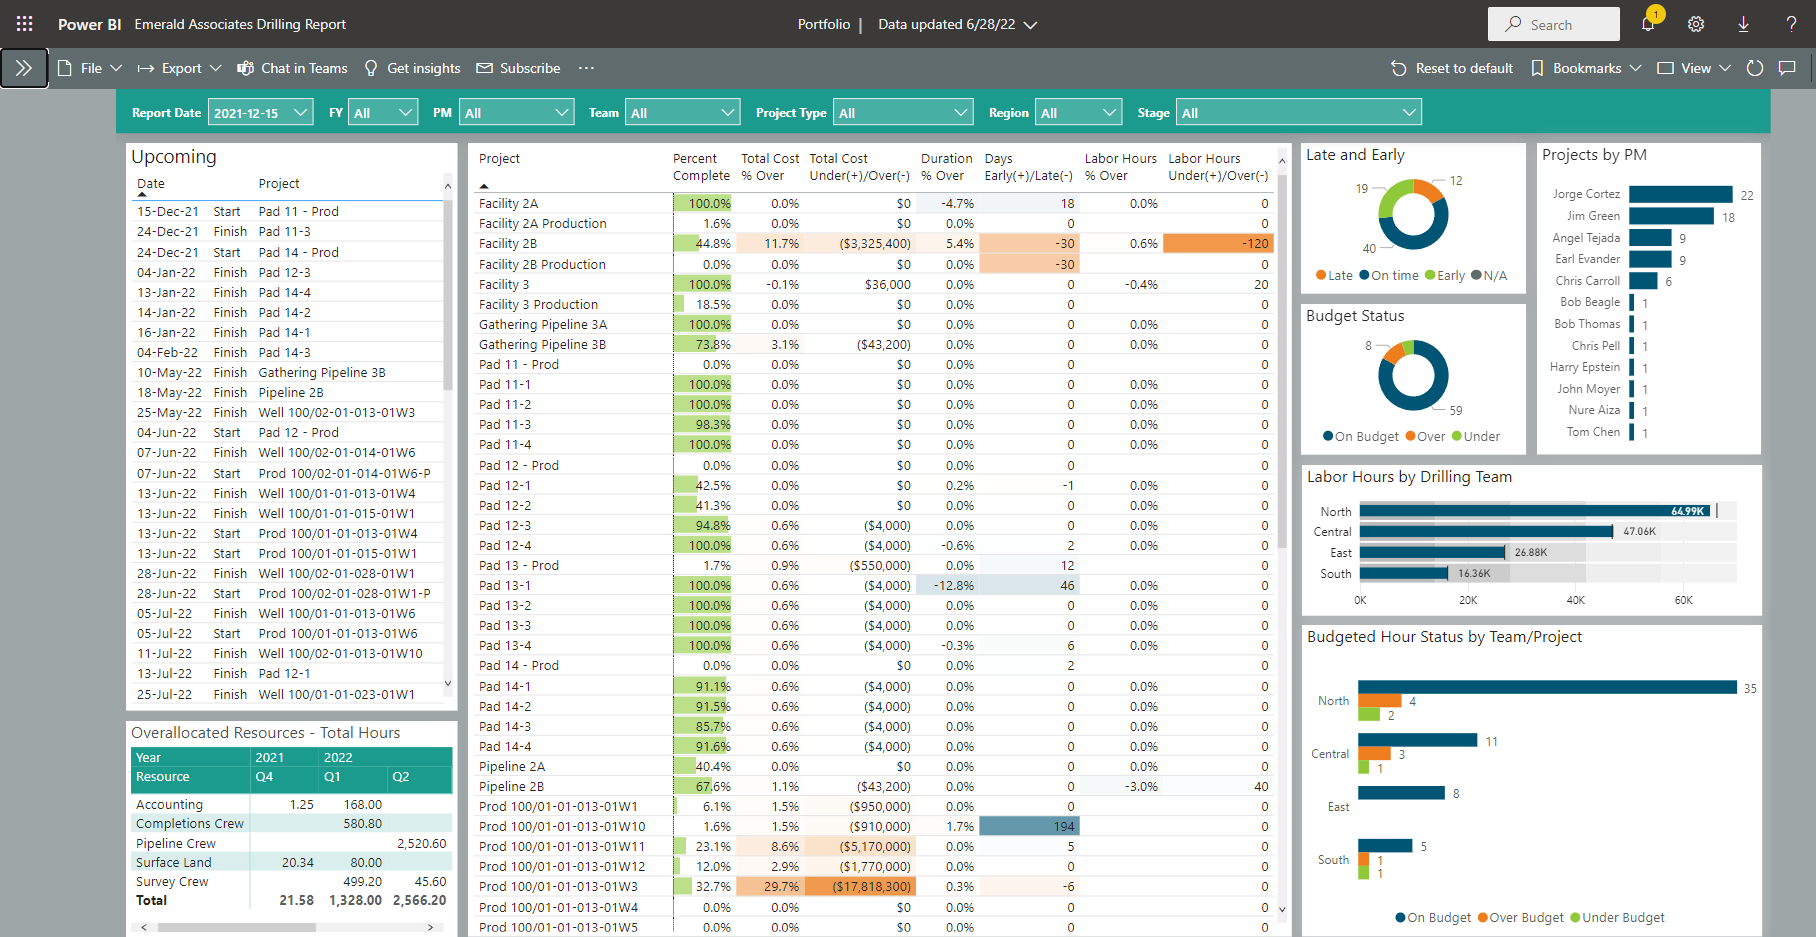
Above is an example of a Portfolio Dashboard available in P6-Reporter that is displayed using Power BI. Self-serve dashboards provide easy access to data in a very easy to digest format. Notice the gradient color coding in these Portfolio screen shots that help focus on issues quickly. Easily re-sort column data by simply clicking on the column headers. Select graph elements and the column elements that are connected to it automatically filter to highlight on the dashboard. (see below)
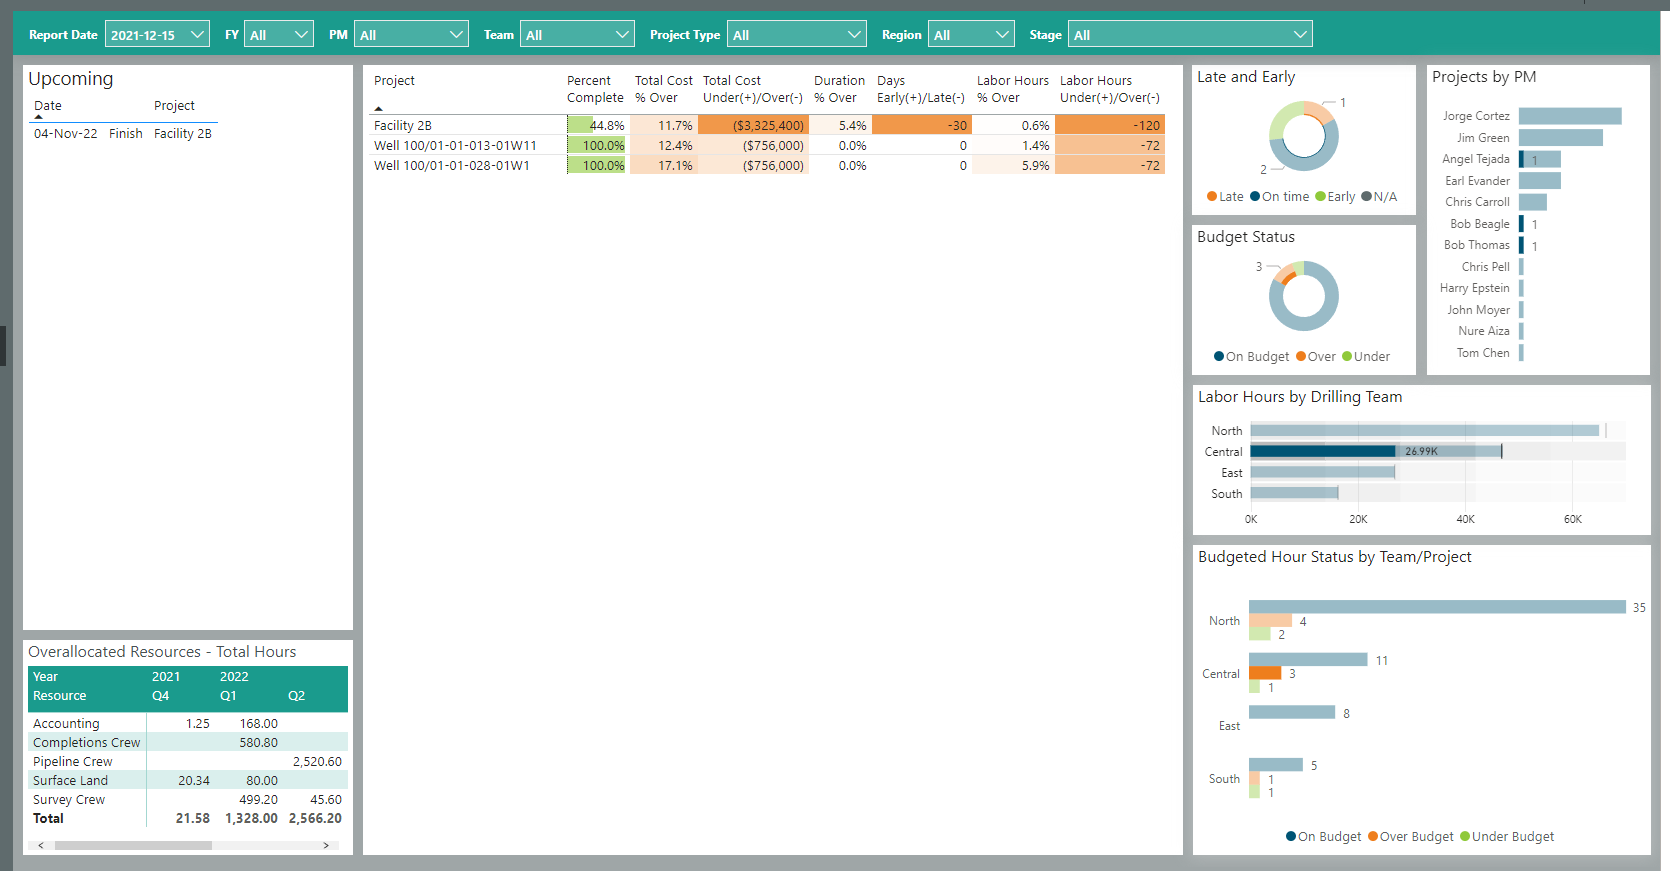
In the screen shot above in the Budgeted Hour Status by Team/Project graph, the Central Team Over Budget is selected. The Portfolio Dashboard we visited is an example of food for thought.
Giving your project team access to self-serve project dashboards provides an easy communication tool that ensures your entire team has access to the project information they require at the level they require in a convenient, easy to digest format all without the labor intensive exercise of issuing paper reports. Providing your team with current information in self-serve dashboards helps ensure informed decisions that are based on current information.
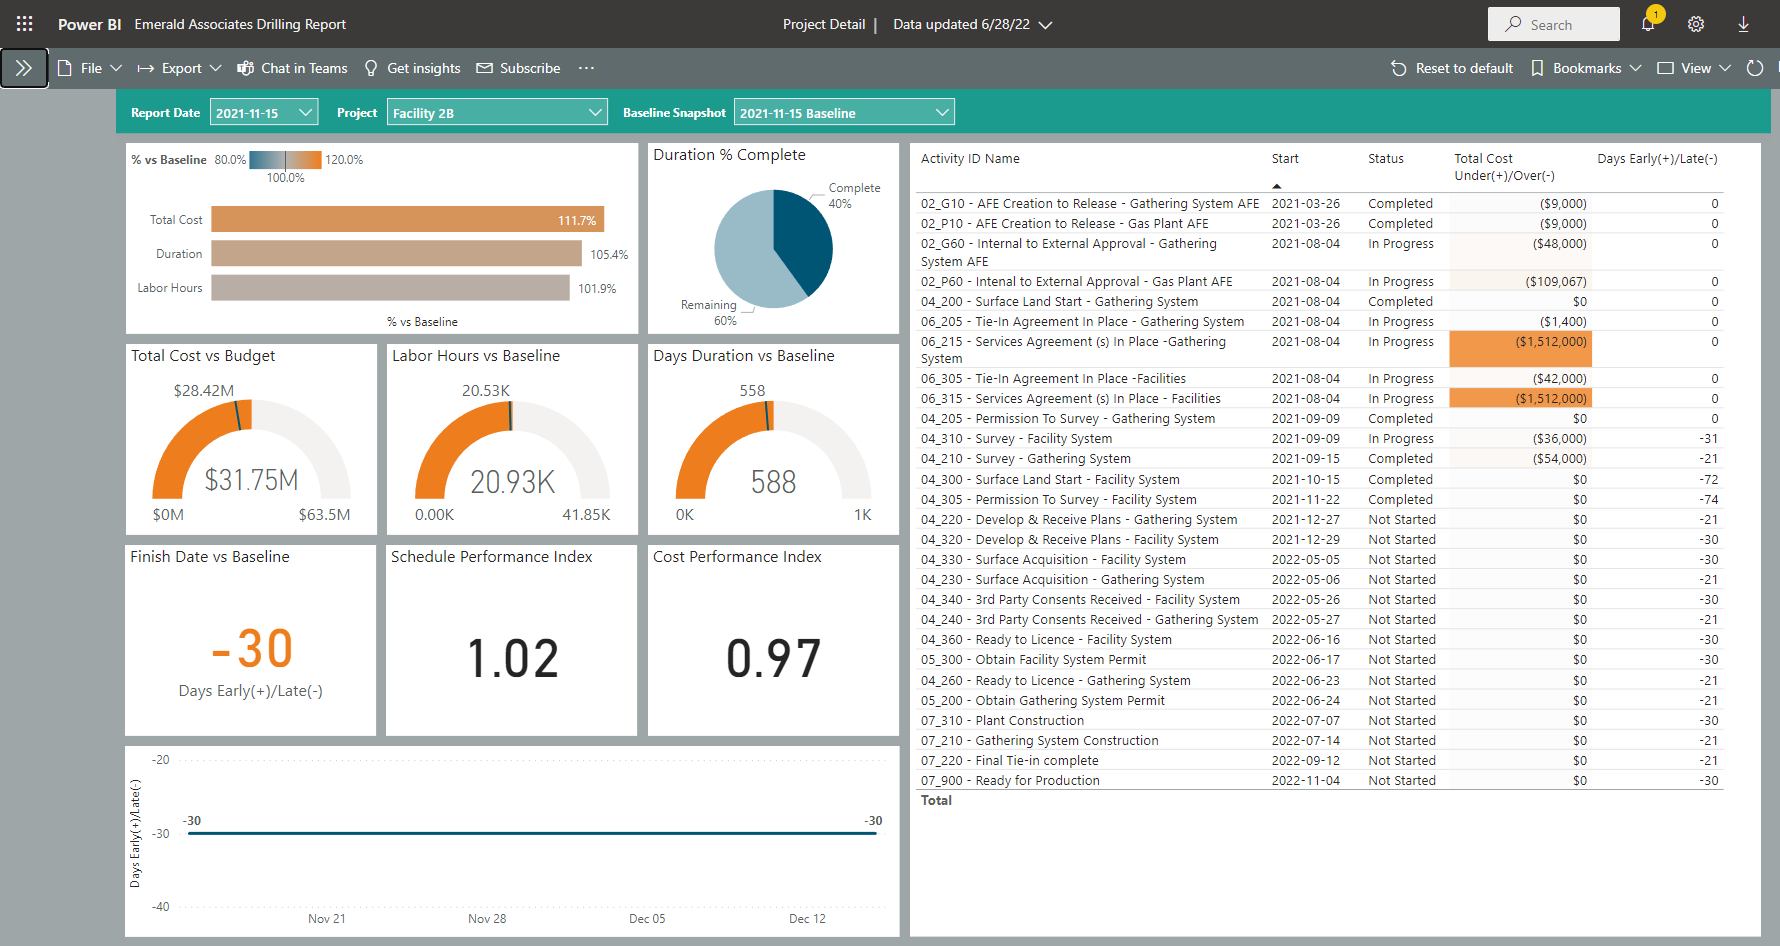
The above screen shot is an example of a project dashboard available using P6-Reporter.
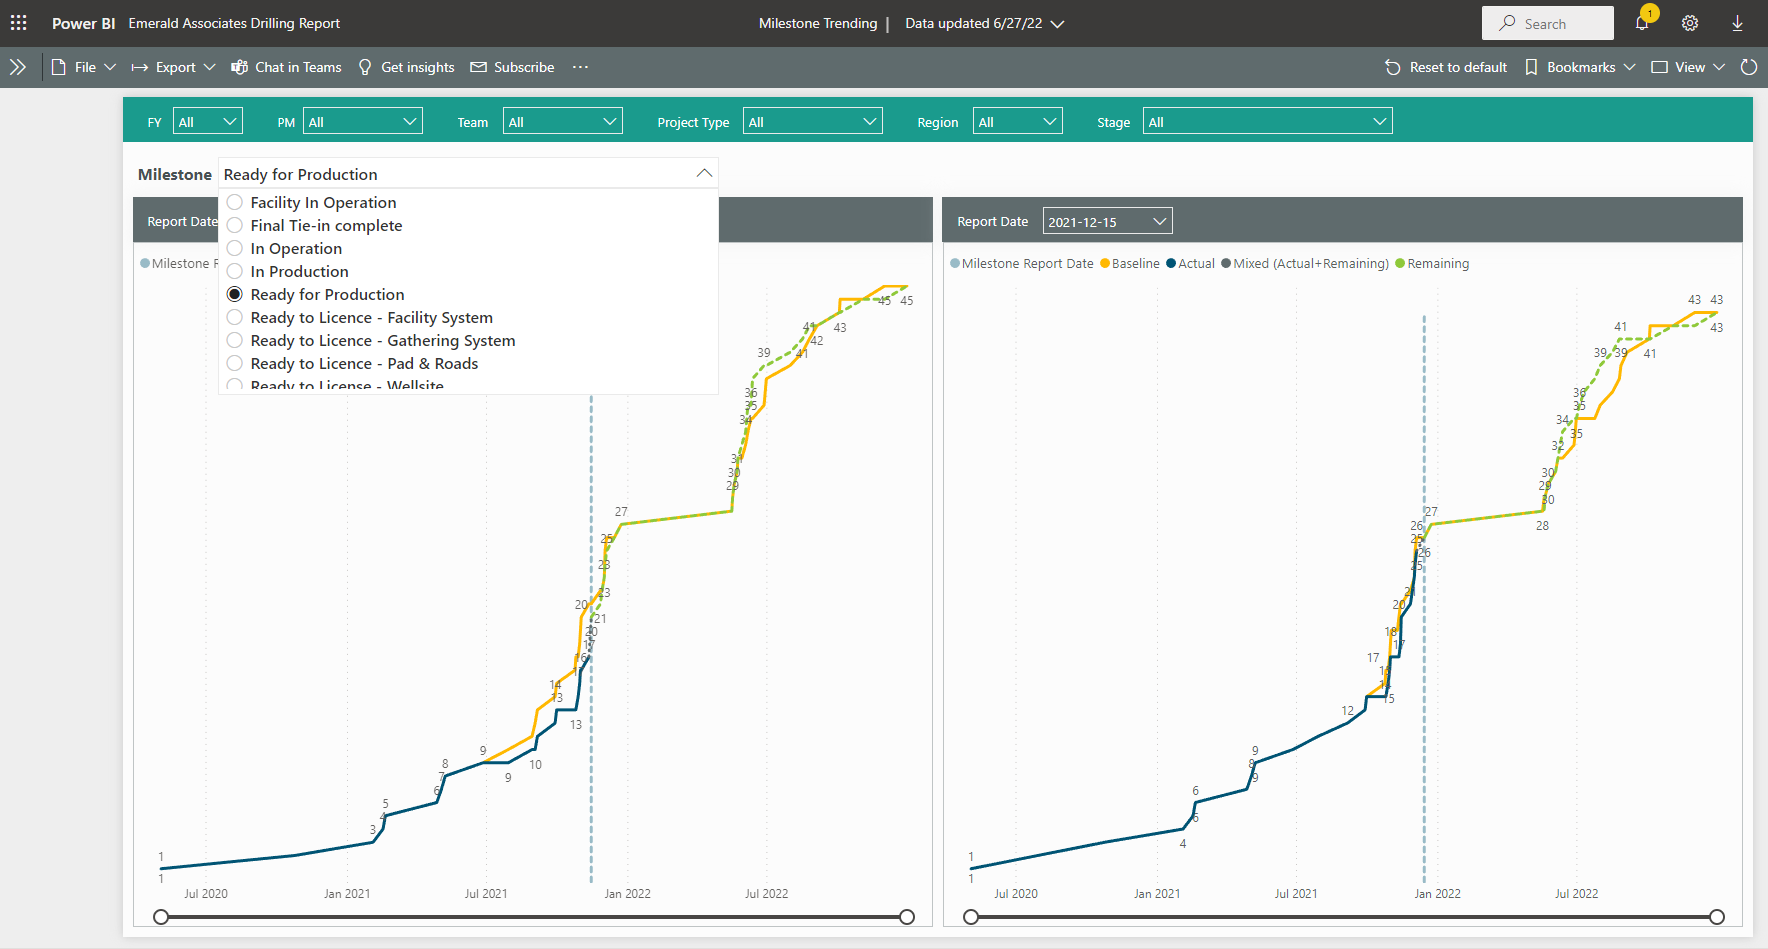
Let’s talk milestone trending. Yes, milestone trending is also available using P6-Reporter. Self-serve filters allow your project team to filter for exactly the information they need to review including the type of milestone (above). Easy review of milestones status, along with filters to focus on specifics, enables tracking milestones in a quick, easy to digest format. All this available at your fingertips in self-serve dashboards.
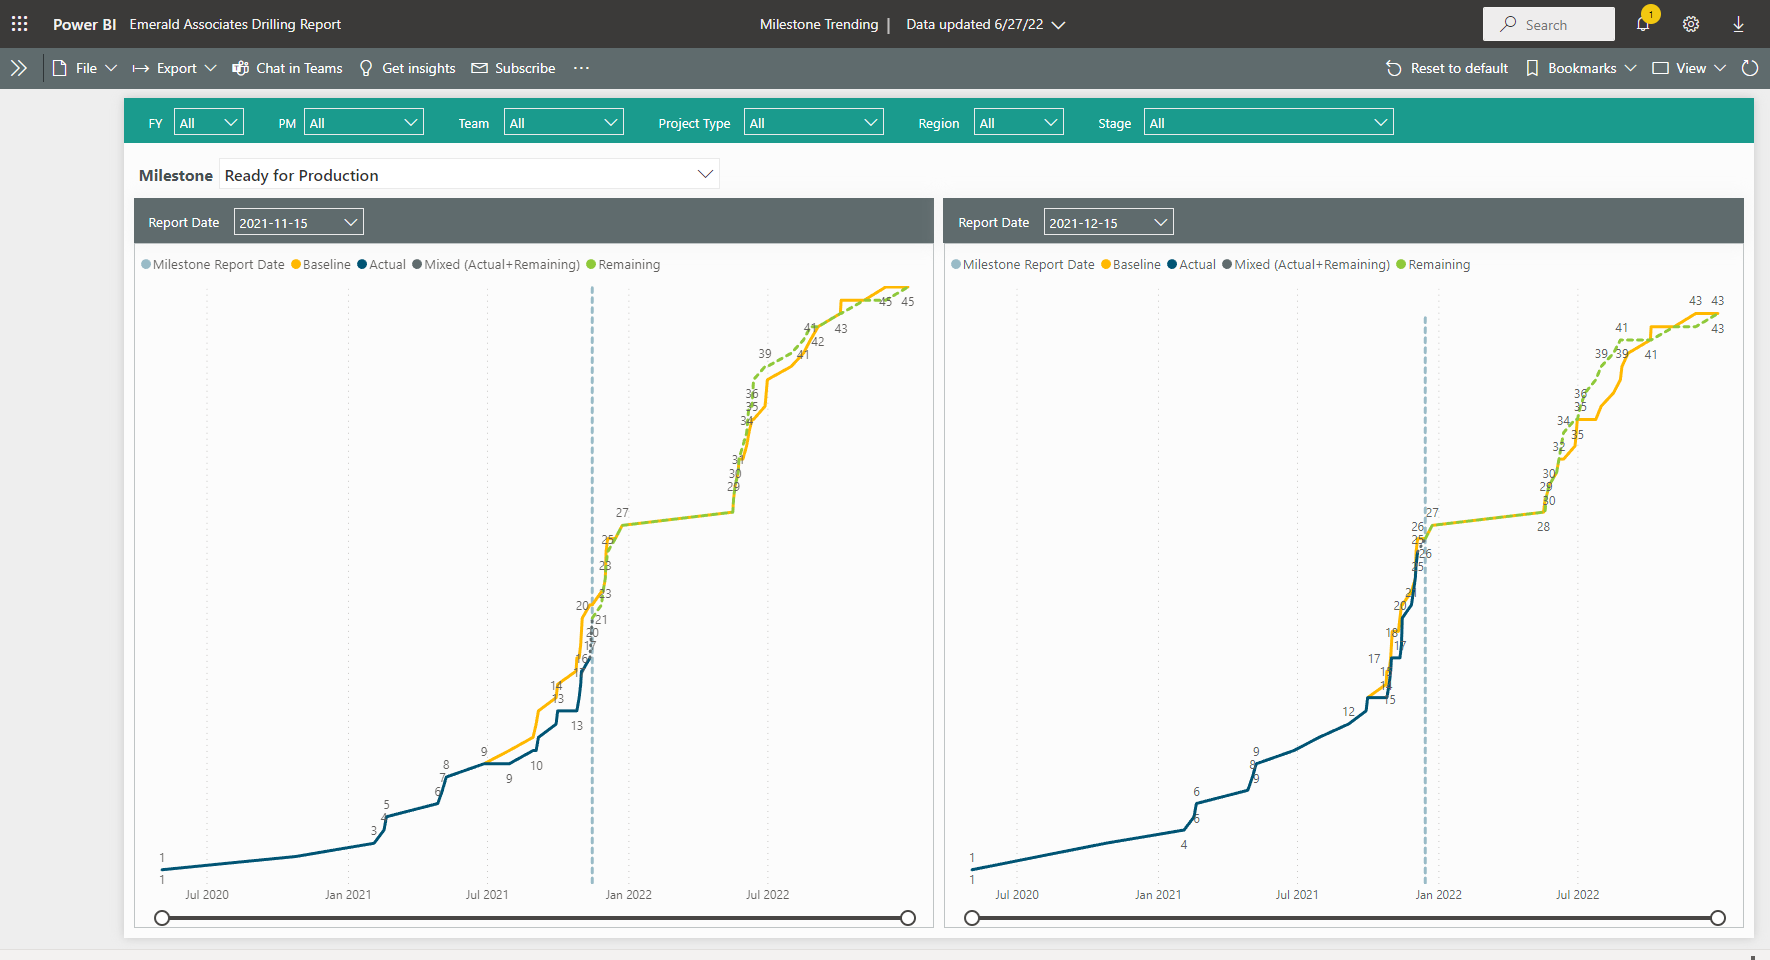
Adjust the report dates combined with the filter items and easily compare exactly the information you require. All this information available using your P6 snapshots without having to login to P6.
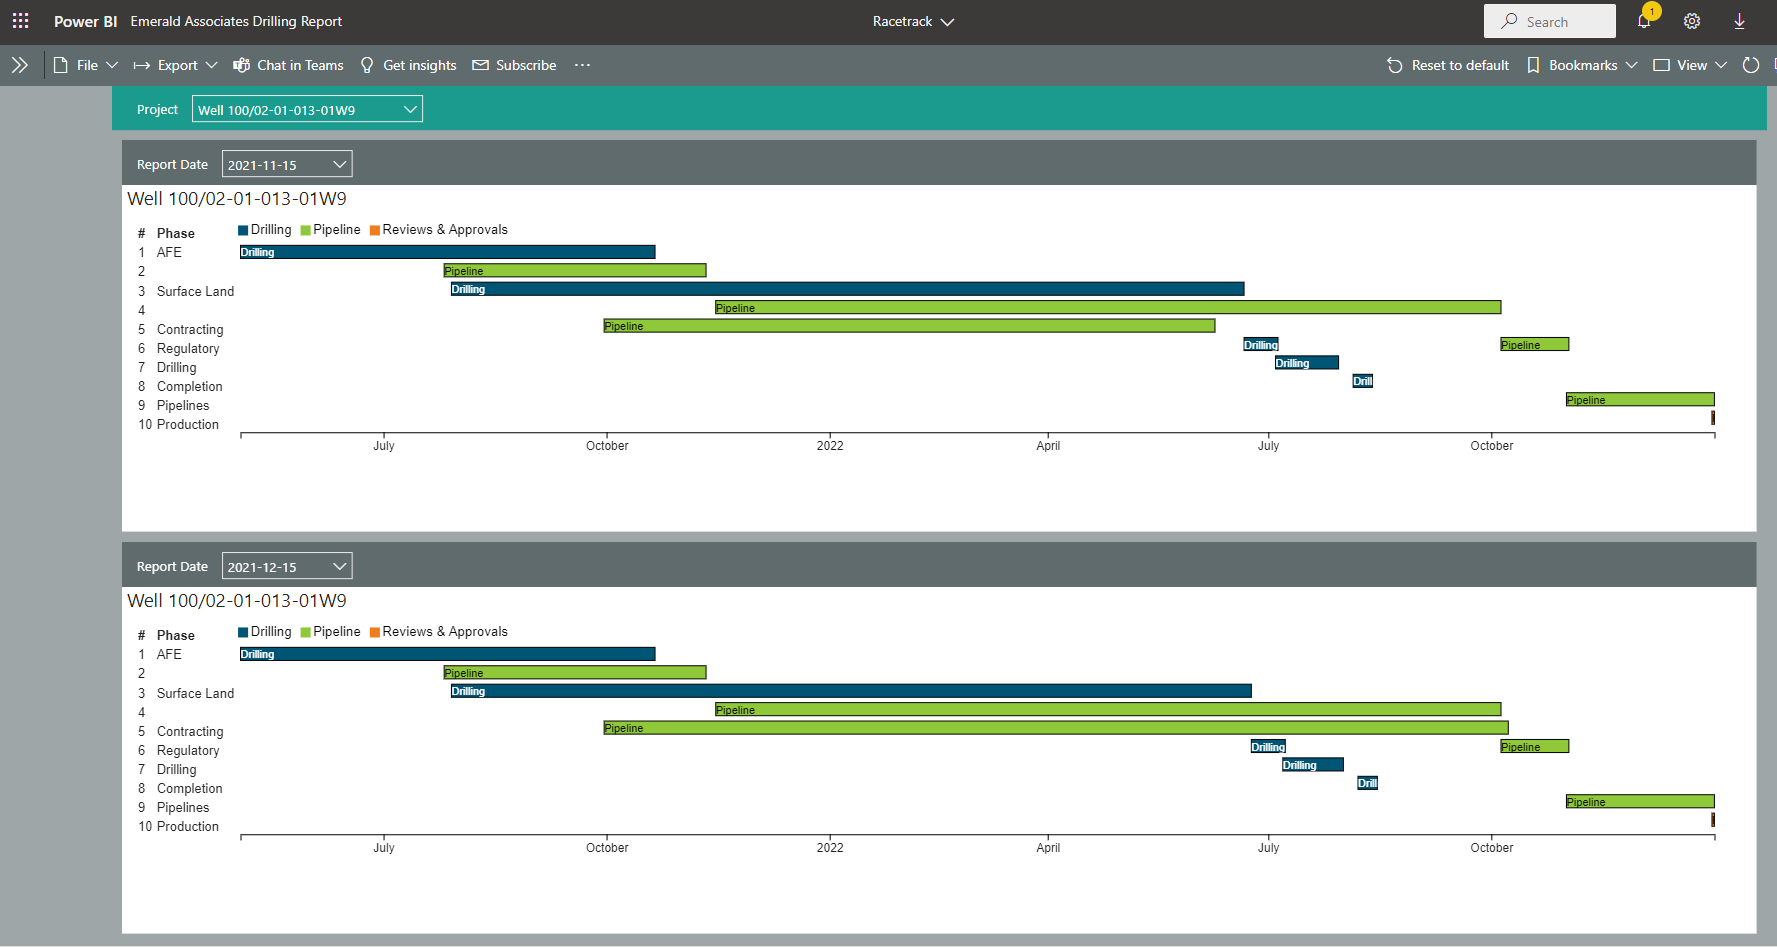
Self-serve dashboards help with direct comparison of data in the format you find most useful. The screenshot above shows a snapshot comparison of two files summarized by phase and work type over time. The user can easily adjust to compare the snapshots required using filters and picklists. These few snapshots are food for thought; P6-Reporter offers a long list of reports. Provide your team with the best tools for the job including self-serve dashboards.
About the Author
Mary Lynn Backstrom, PMP, PMI-SP, PMI-BA – Implementation Specialist
Mary Lynn spent many years filling a variety of project controls duties such as planning, scheduling, analyzing, training and continuous improvement in the Aerospace Industry. Since joining Emerald in 2008, she has been a tremendous asset to the Emerald team. She has worked as a lead scheduler for turnarounds, led sessions for review and troubleshooting of scheduling and reporting, created and given custom training courses for clients, and is a sought after Primavera P6 trainer.
Mary Lynn enjoys some very diverse spare time activities. Along with a variety of outdoor activities such as gardening, she also enjoys making life size lawn ornaments for special holidays like Christmas. Mary Lynn is known for her participation in the community as well. You may have seen her walking in fundraisers in Edmonton and Calgary for the Cancer Society.
