P6-Reporter: Self-Serve Dashboards - Commodities
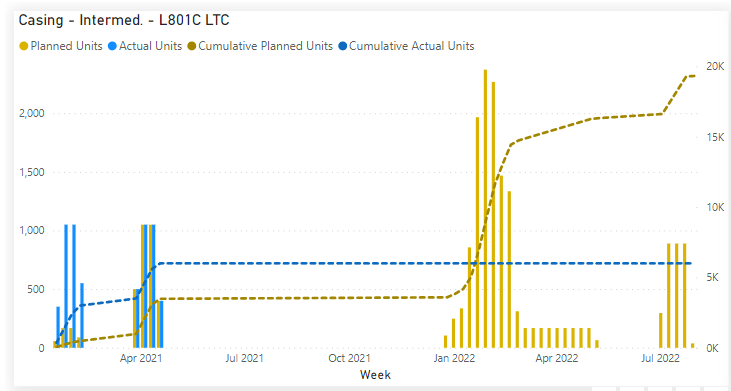
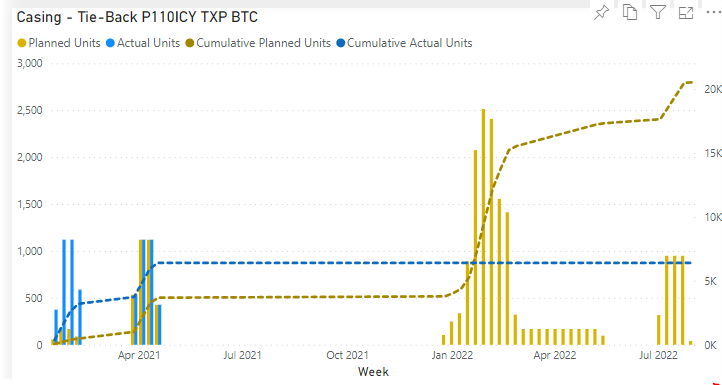
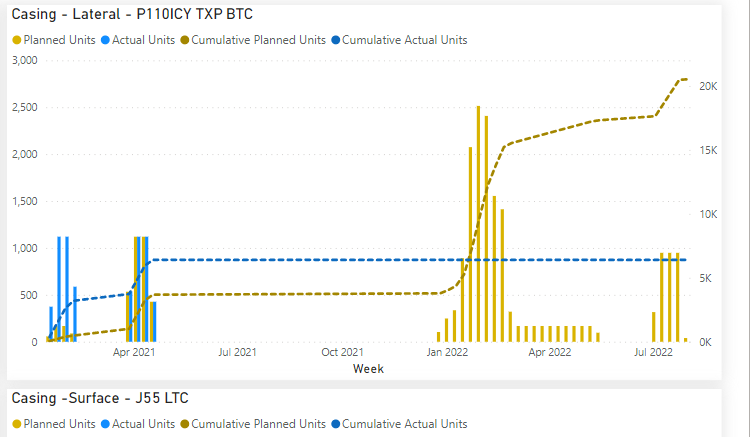
Enjoy easy access to planned and actual values for commodities in an easy to digest format.
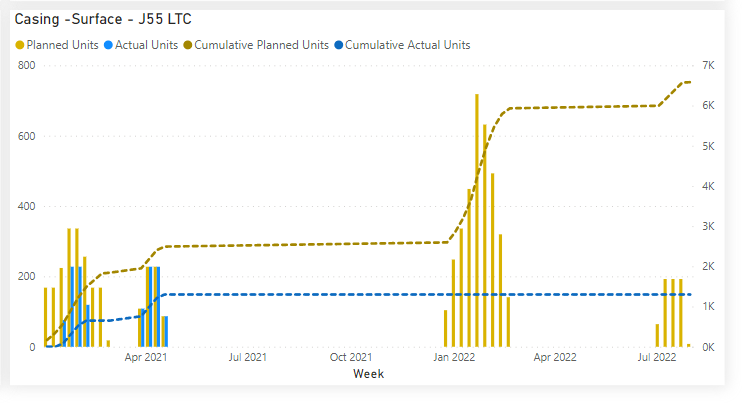
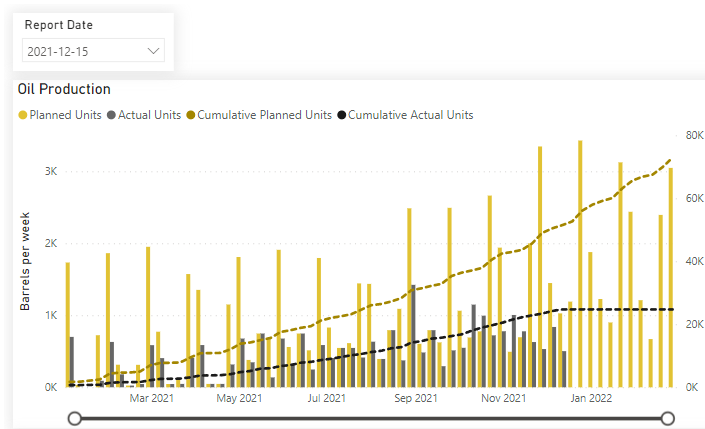
As of the report date (snapshot date), Oil Production is displayed above.
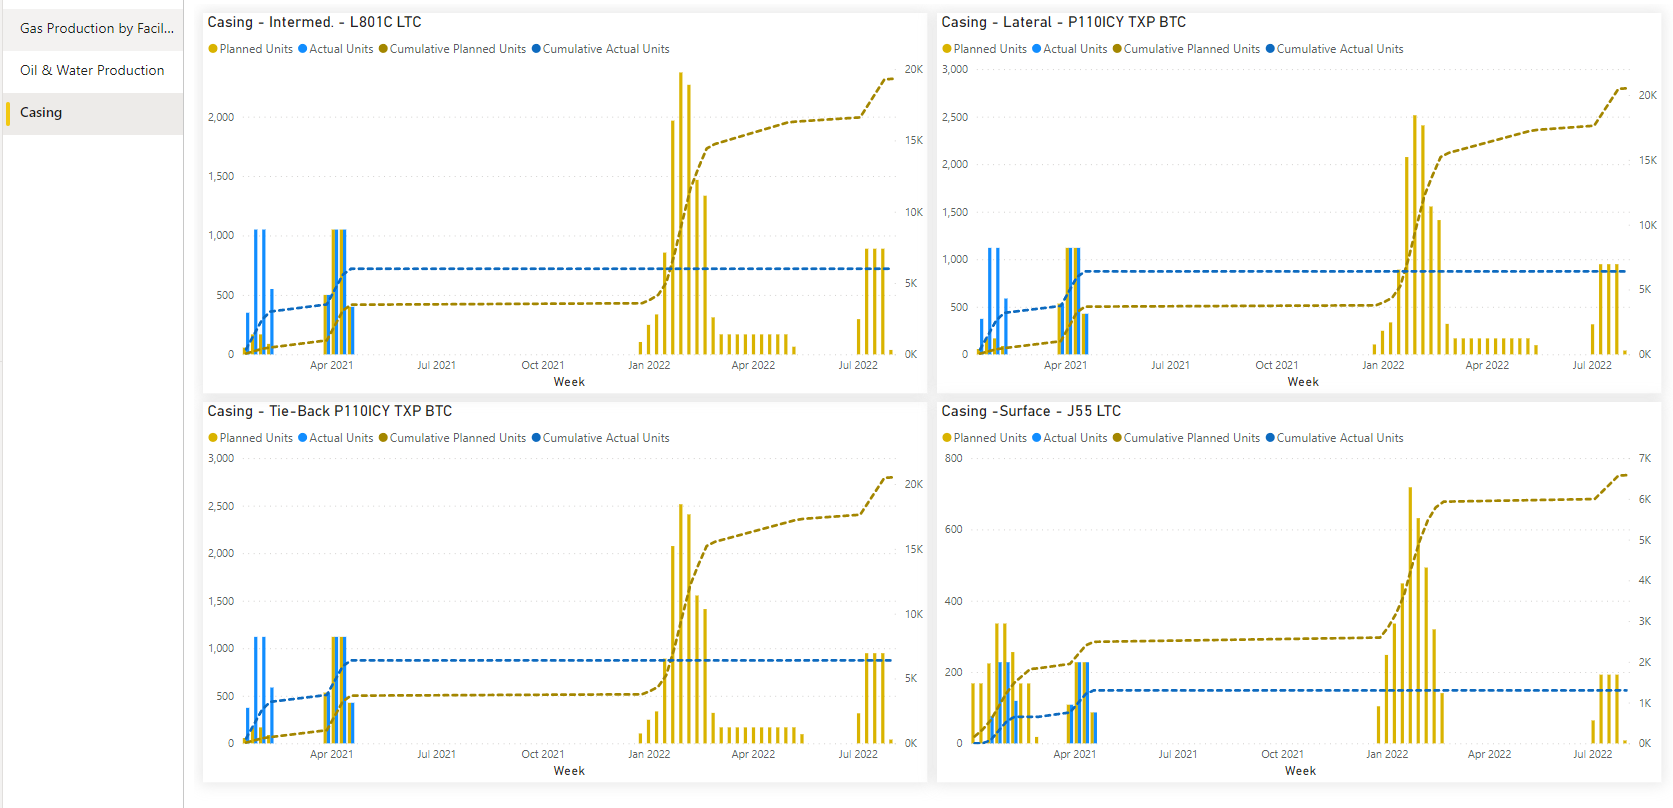
View reports individually or in the dashboard tabs (all reports) for each report type.
The same type of graphs can be created to track other commodities from your specific project types. Portfolio project information in an easily digested format can be available to your team in self-serve dashboards.
About the Author
Mary Lynn Backstrom, PMP, PMI-SP, PMI-BA – Implementation Specialist
Mary Lynn spent many years filling a variety of project controls duties such as planning, scheduling, analyzing, training and continuous improvement in the Aerospace Industry. Since joining Emerald in 2008, she has been a tremendous asset to the Emerald team. She has worked as a lead scheduler for turnarounds, led sessions for review and troubleshooting of scheduling and reporting, created and given custom training courses for clients, and is a sought after Primavera P6 trainer.
Mary Lynn enjoys some very diverse spare time activities. Along with a variety of outdoor activities such as gardening, she also enjoys making life size lawn ornaments for special holidays like Christmas. Mary Lynn is known for her participation in the community as well. You may have seen her walking in fundraisers in Edmonton and Calgary for the Cancer Society.
