P6-Reporter - Progress Summary Reports in Tableau
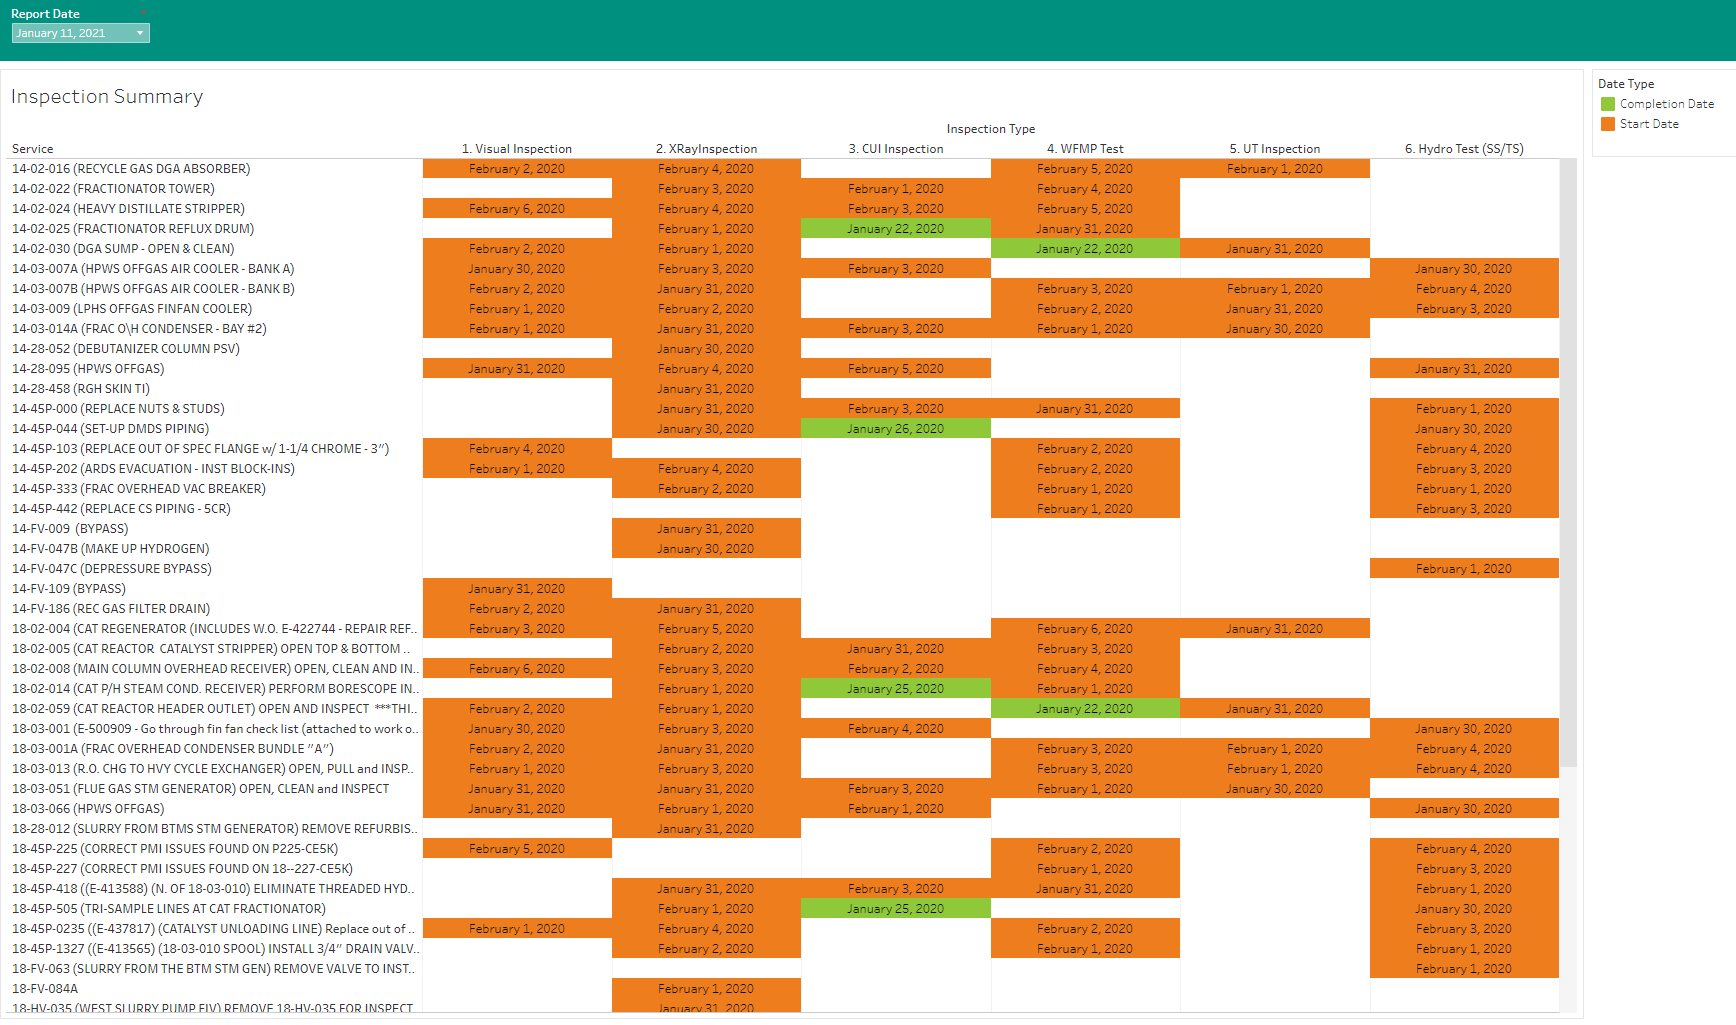
With P6-Reporter, you can easily view the overall progress and also quickly pick up on areas where there is an issue you need to address. You can tell at a glance if there is missing progress, investigate and address it.
Below are some additional summary report examples. All easily summarize progress for exchanger and piping work as well as relief valves and control valves. In all cases you can easily digest the progress completed, and the reports are very visual indicators of where there may be issues that you need to address immediately.
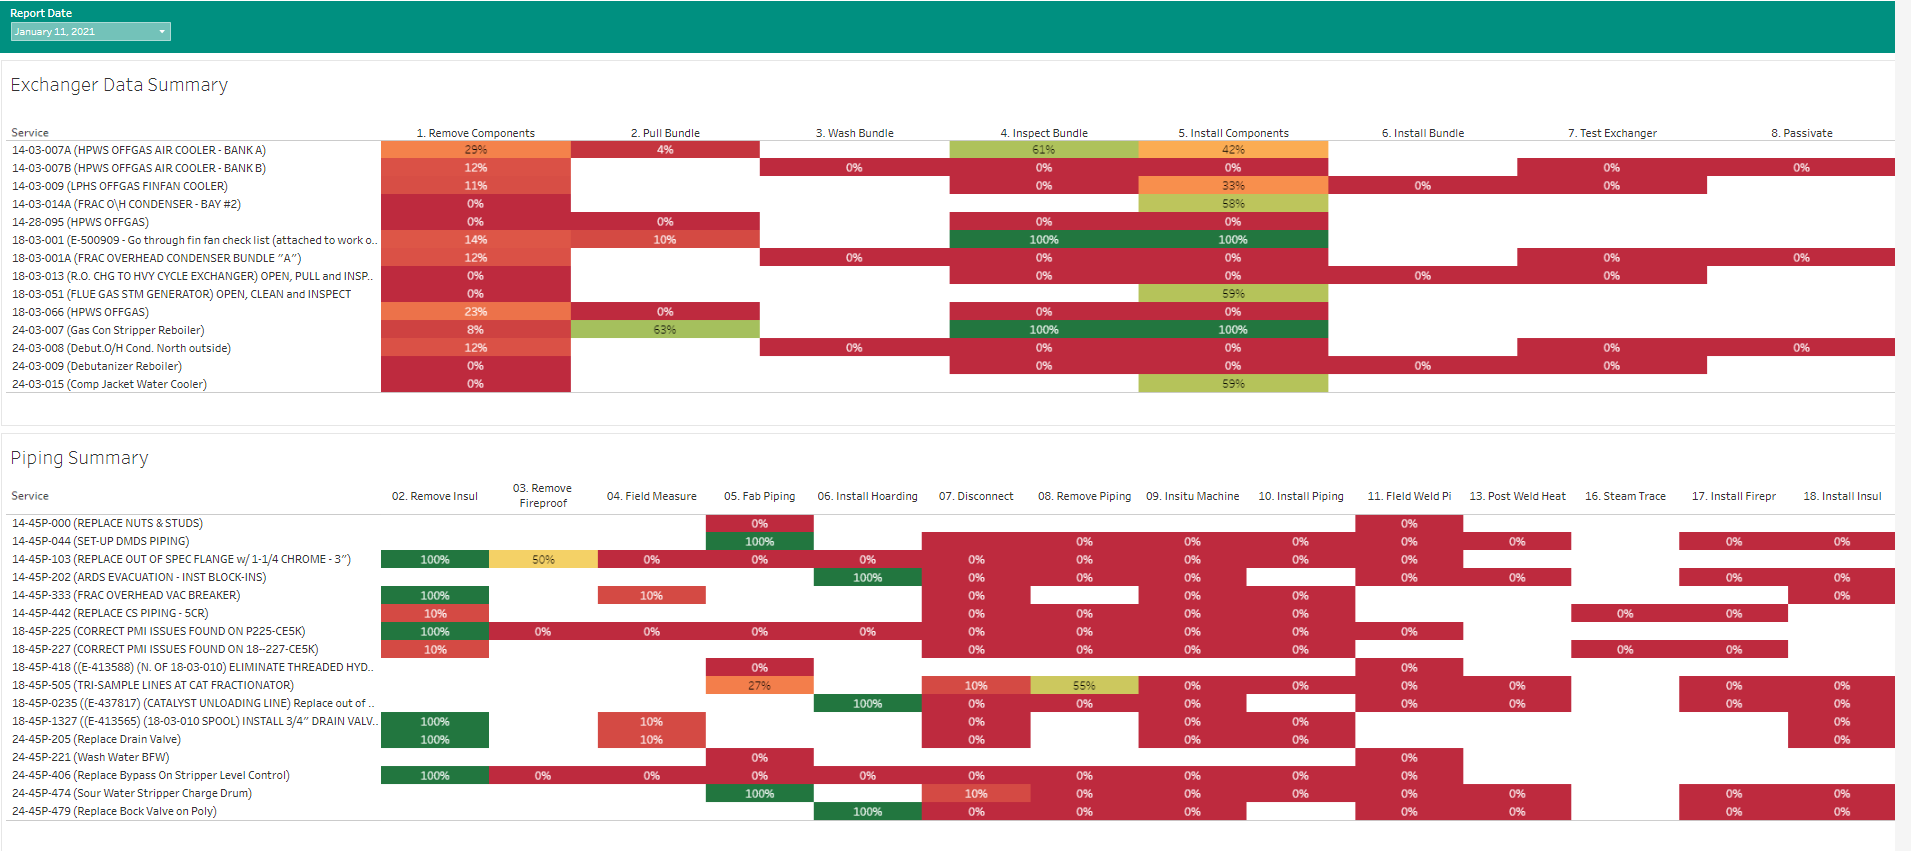
Exchanger Data Summary/Piping Summary
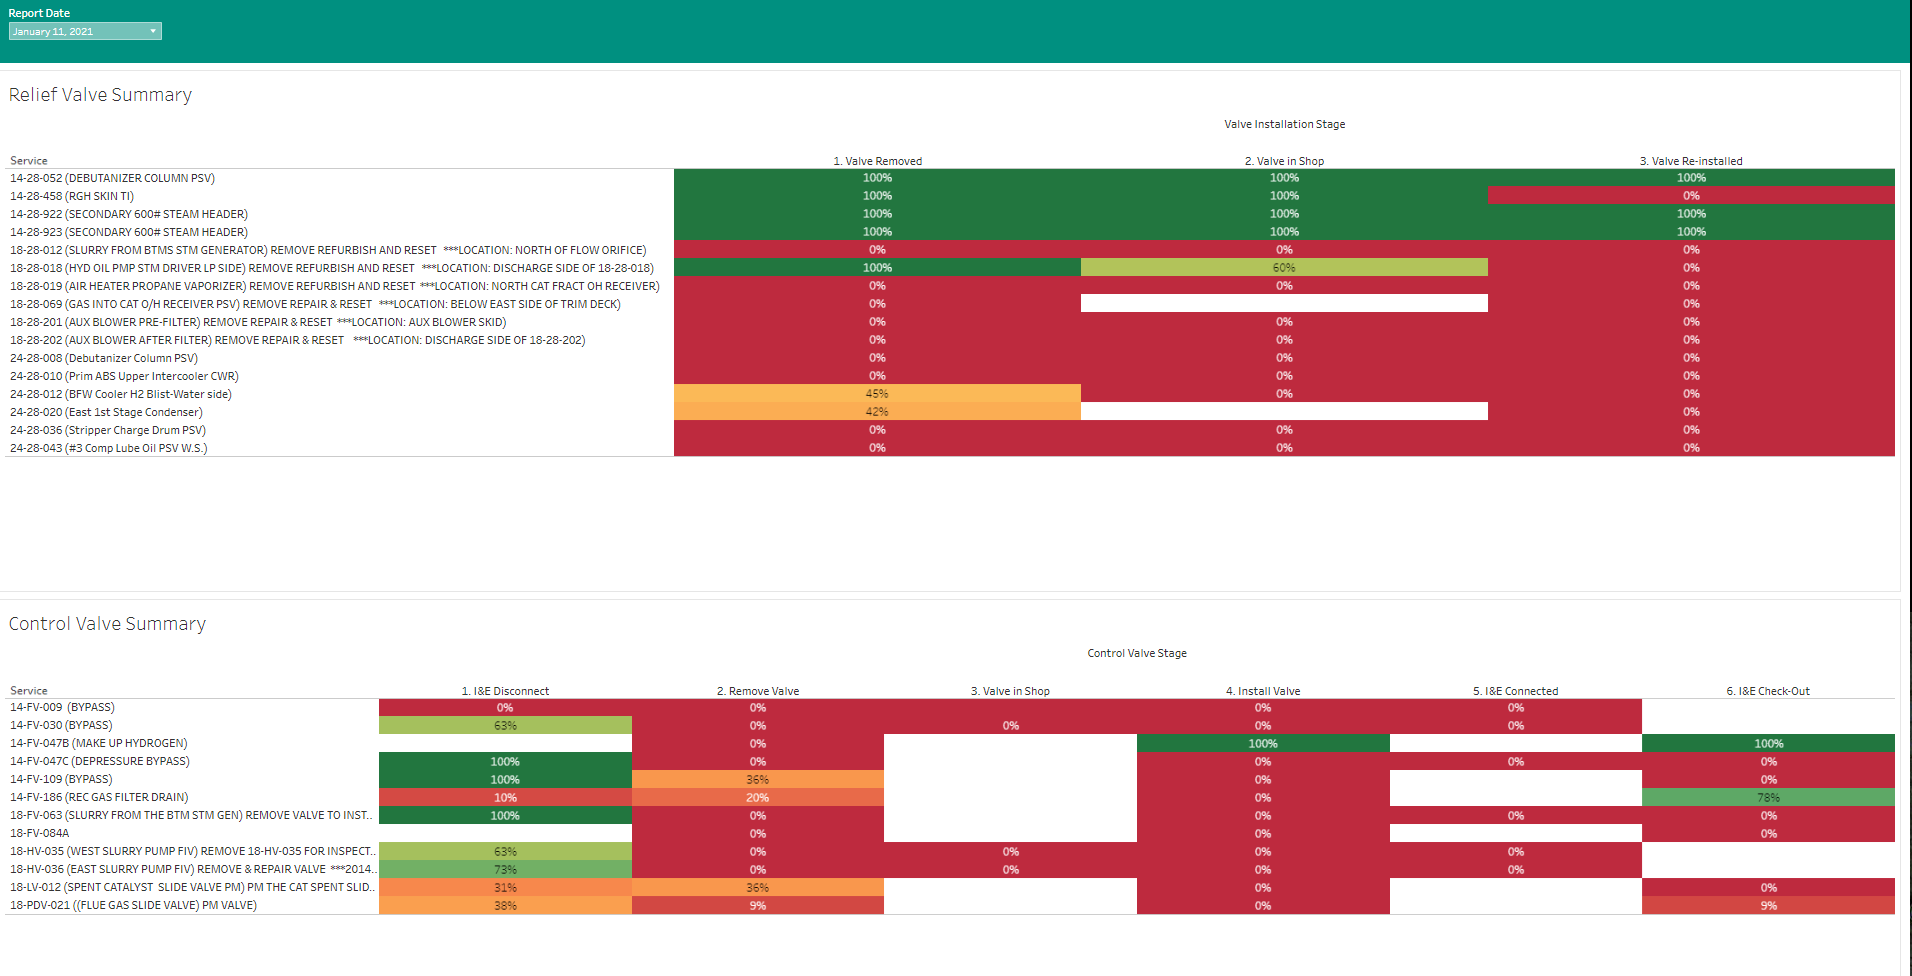
Relief Valve/Control Valve
Self-serve dashboards provide quick, current, and easy to digest project information while streamlining the reporting process on your project.
About the Author
Mary Lynn Backstrom, PMP, PMI-SP, PMI-BA – Implementation Specialist
Mary Lynn spent many years filling a variety of project controls duties such as planning, scheduling, analyzing, training and continuous improvement in the Aerospace Industry. Since joining Emerald in 2008, she has been a tremendous asset to the Emerald team. She has worked as a lead scheduler for turnarounds, led sessions for review and troubleshooting of scheduling and reporting, created and given custom training courses for clients, and is a sought after Primavera P6 trainer.
Mary Lynn enjoys some very diverse spare time activities. Along with a variety of outdoor activities such as gardening, she also enjoys making life size lawn ornaments for special holidays like Christmas. Mary Lynn is known for her participation in the community as well. You may have seen her walking in fundraisers in Edmonton and Calgary for the Cancer Society.
