Green Up Reports - Versatile Summarizations
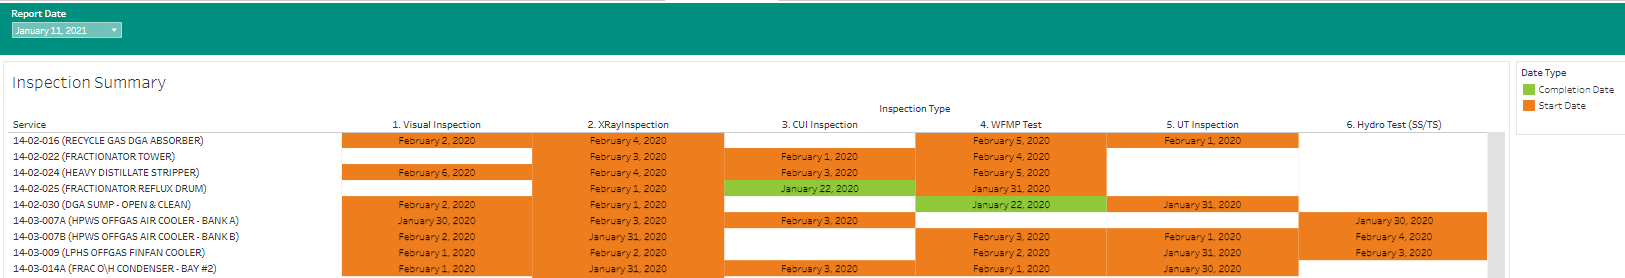
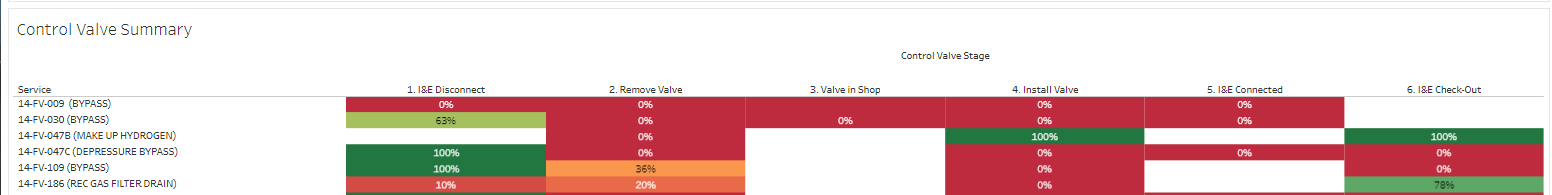
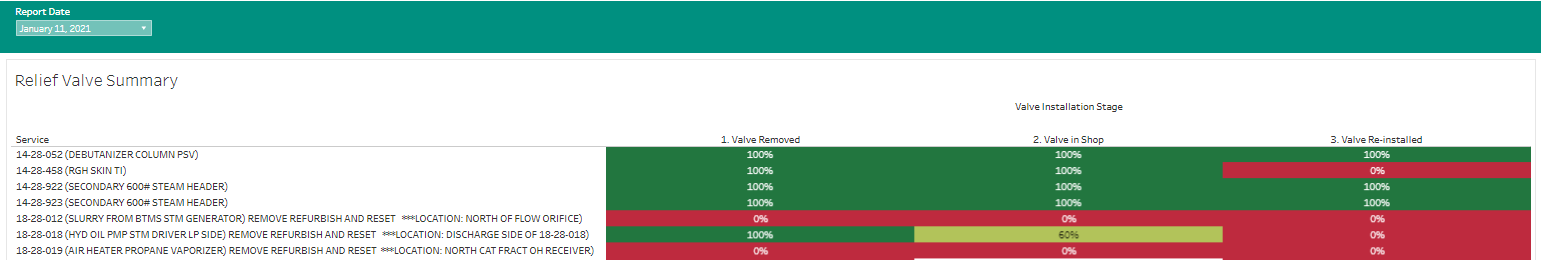
Although you may be tracking very different elements from those shown below in the sample Control Valve Summary report and Relief Valve Summary report, with a green up report configured to track items specific to your schedule you are streamlining not only your reporting but also your communications. Give your team easy to digest, easy to use self-serve dashboards using P6-Reporter reports.
Using P6-Reporter with automated snapshots, the process does not rely on manually creating snapshots. Manual snapshots are available if required, but the whole snap shot process can be automated. The result is one less task your team needs to manually address with each schedule update, with the snapshots providing quick access to current self-serve dashboards. Keep in mind that P6-Reporter offers numerous types of reports. Streamline your communication and reporting.
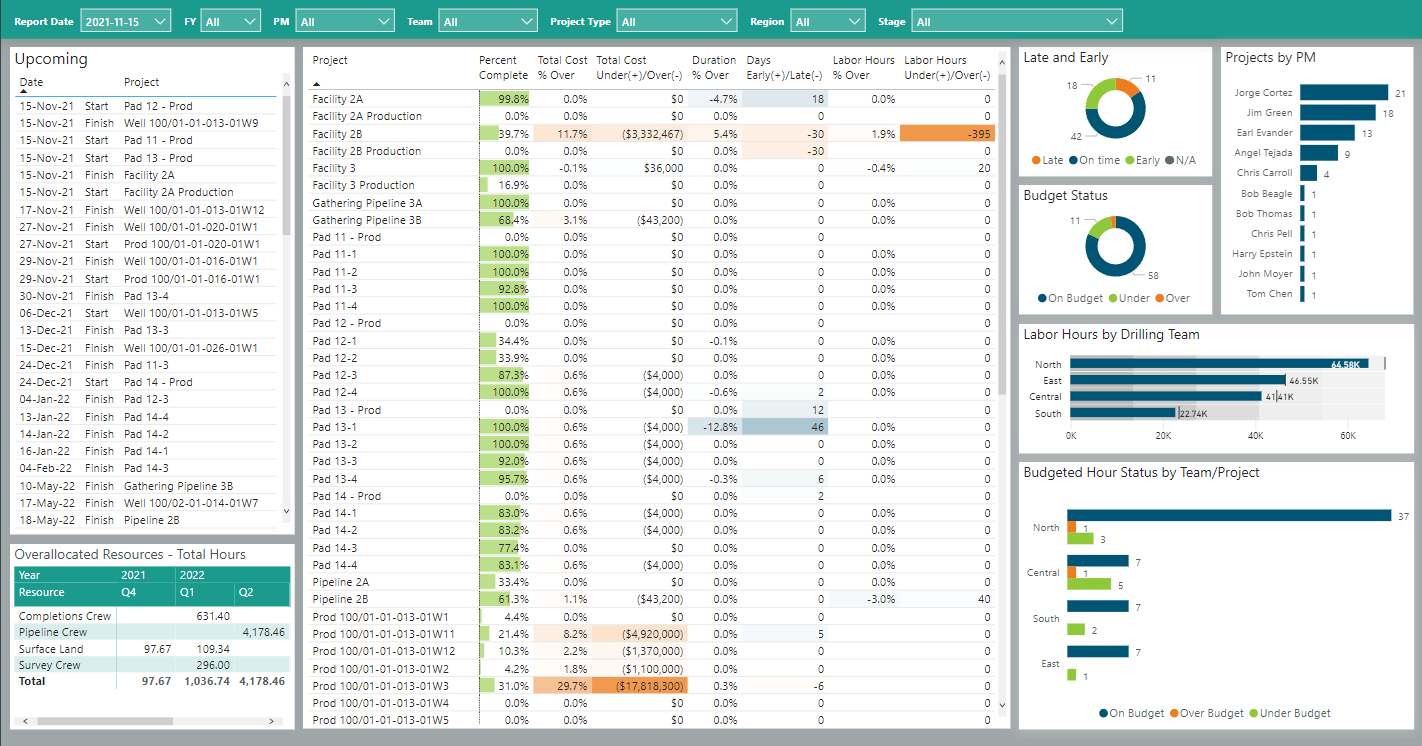
Using P6-Reporter, configure management dashboards to combine specific dashboard elements and provide management with current overall project information in an easy to digest format allowing easy visual identification of any issues in their portfolio that require immediate attention along with the overall status of their projects.
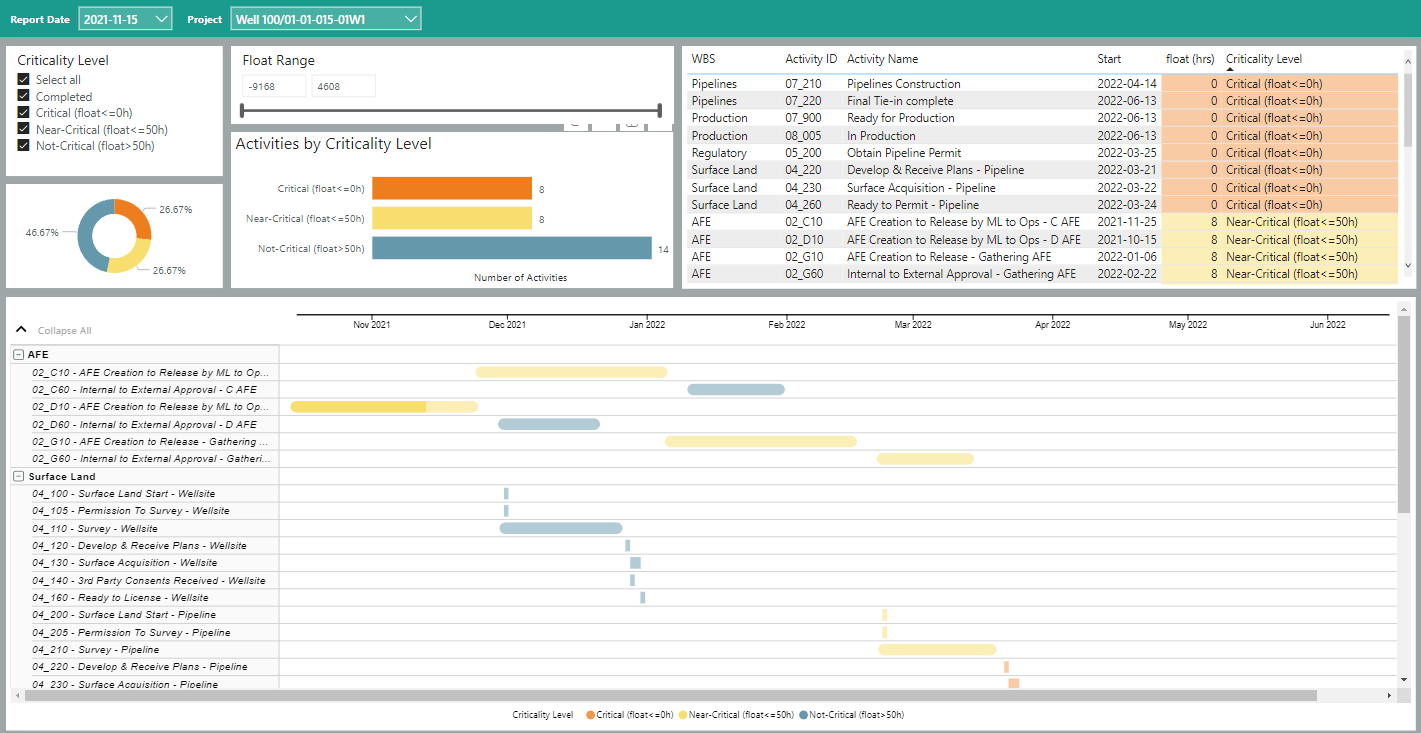
At the project level, one of the many available reports is the Activity Criticality report.
Regardless of the project type, streamlined reporting and communication is a positive. Provide your project teams with current, easy to digest, self-serve dashboards to assist with well informed, timely project decisions.
About the Author
Mary Lynn Backstrom, PMP, PMI-SP, PMI-BA – Implementation Specialist
Mary Lynn spent many years filling a variety of project controls duties such as planning, scheduling, analyzing, training and continuous improvement in the Aerospace Industry. Since joining Emerald in 2008, she has been a tremendous asset to the Emerald team. She has worked as a lead scheduler for turnarounds, led sessions for review and troubleshooting of scheduling and reporting, created and given custom training courses for clients, and is a sought after Primavera P6 trainer.
Mary Lynn enjoys some very diverse spare time activities. Along with a variety of outdoor activities such as gardening, she also enjoys making life size lawn ornaments for special holidays like Christmas. Mary Lynn is known for her participation in the community as well. You may have seen her walking in fundraisers in Edmonton and Calgary for the Cancer Society.
