P6-QA - Ready to Report
Your P6-QA metrics are now available in Power BI reports. You can also create custom reports via our P6-Reporter tool.
Put it All In One Place
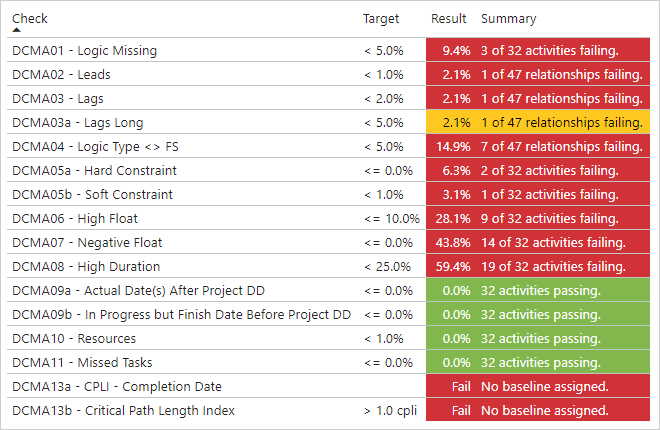
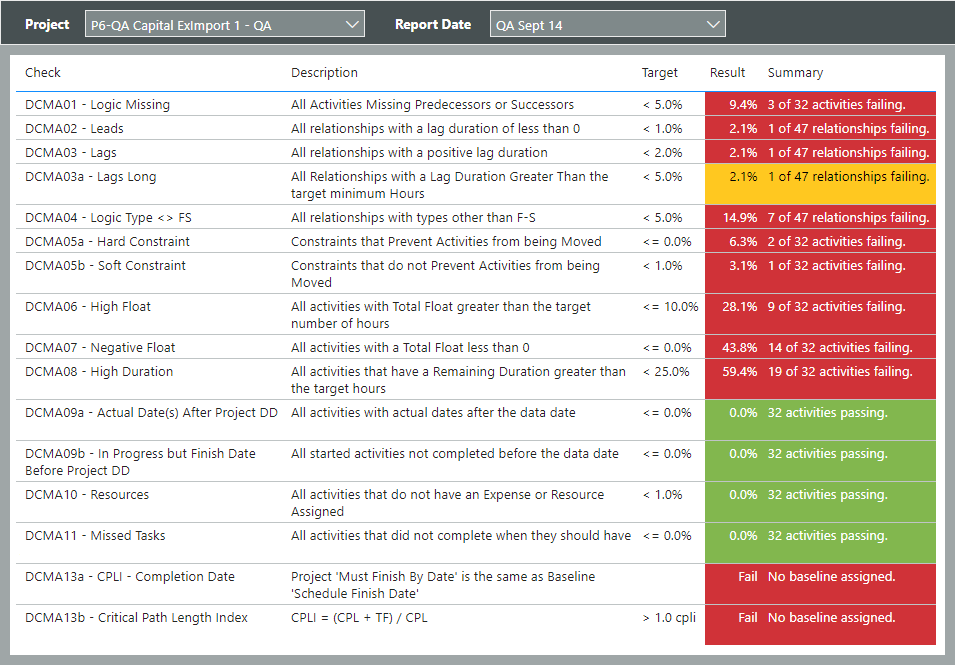
It’s not efficient for your management to log into your reports and then again into P6 to get the rest of the story. You can now take the schedule quality metrics that P6-QA calculates and put them where your team needs them.
More Dynamic Visuals
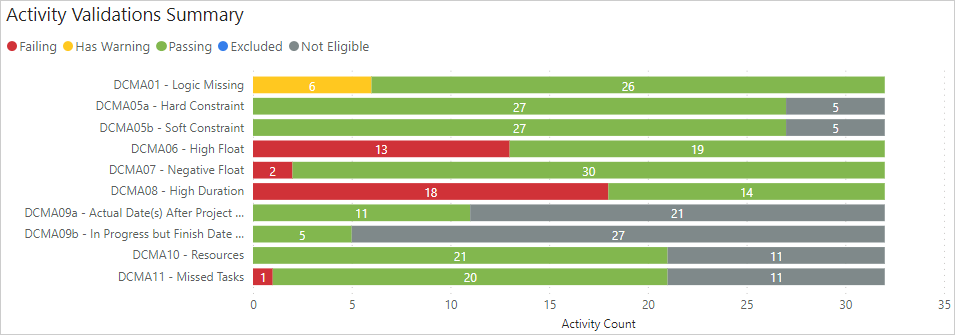
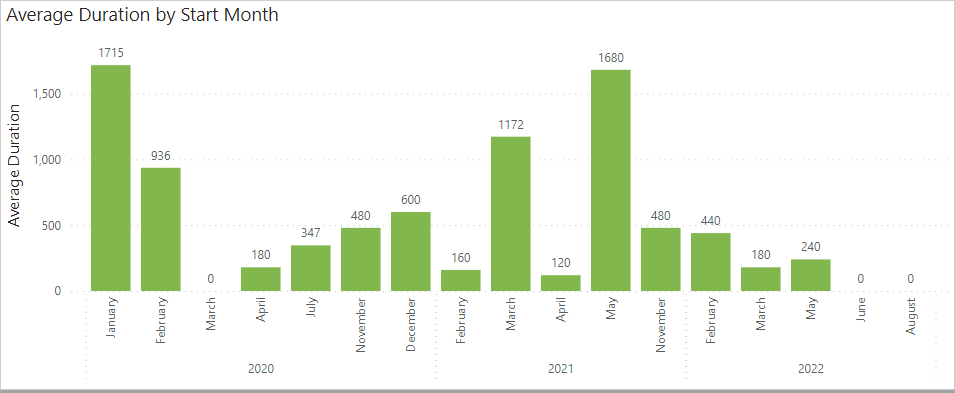
Having QA reports in P6 is very handy for your schedulers, but P6 notebooks have their limitations in their ability to display complex visuals. Adding professional quality reporting tools to the mix opens the doors for a variety charts, presentation formats and trending information that allows you to visualize your data even better.
We have ready to use reports available in Power BI. Please attend one of our free P6-QA or P6-Reporter Webinars to take a closer look. Reports in Tableau will be coming soon.
Use the Reporting Tool of Your Choice
We’ve made all of the information that you see in Primavera P6 available through our P6-Reporter tool, and prepared them so that they’re ready to add to your existing reports. P6-Reporter stores your data in Oracle databases; so you can produce reports In Power BI, Tableau, ODV and nearly every other reporting tool out there.
About the Author
James Andrade - Integration Specialist
James is a professional software developer and was trained at SAIT in Calgary. He specializes in Primavera P6 report development using Power BI, Tableau and Oracle Data Visualization, from a variety of sources, including Primavera Data Warehouse, direct-to-P6 reporting and Emerald's own P6-Reporter.
