Why Use P6-Reporter When You Could Use XER Files for Free?
There are many approaches to creating reports from your P6 data, and while free always sounds like the right price, we all know that you get what you pay for. Before you choose an approach, you owe it to yourself to fully assess its strengths and weaknesses. In this article, we’ll compare reporting using XER files versus our own tool: P6-Reporter.
xers
Primavera P6 allows you to export your project files in several formats, of which XER files are the most popular. Most modern reporting tools, such as Power BI, have everything built in that you need to the extract data and transform it so that it can be used in your reports. If the reporting tool you’d like to use can’t do this, the tables can still be extracted into a secondary tool, such as Microsoft Excel, and then imported. It is also possible to combine multiple projects in a report from multiple points in time.The table structure found in XERs is identical to that found in the database of P6. These tables are not setup for reporting but rather to be accessed by P6 software. They are setup in a format that stores the information efficiently, without duplication and allows dynamic behaviour, like the ability to be modified. One consequence of this is that the data is divided into many tables with relationships that can be unintuitive for the average report developer. Another consequence is any field you see in P6 that can be calculated by taking core fields and applying a formula are not stored. This makes developing reports directly off of these tables challenging.
Let’s break it down by category.
Automation
Projects exported from P6 into XER files can only be done one at a time. Likewise, they will need to be loaded into your reporting software, transformed and combined with the existing tables one at a time. It is a manual process, and there is no getting away from this. Even if you assume 10 minutes per project, (a rather optimistic assumption) it would take 10 hours to update 60 projects every reporting cycle. Manual work is also error prone. What happens if you label a file with the wrong project name? What if you miss a project? What if you miss a project and don’t notice until several weeks later?P6-Reporter, on the other hand, can be fully automated. It will capture your data at the times and frequency chosen by you and store it for your reports. The only manual part is clicking the refresh button in your report to see your latest data.
Speed is another aspect of automation that can’t be overlooked. If you want to capture the data on Friday and have it ready to present by Monday morning, manually updating XER files may not be a reliable approach.
Report Maintenance
The reality of most operations is that you often have more than one report. If you have multiple employees working on creating reports, they’ll each have their own file. But also, it’s a common practice for the reports that readers see to be made up of several smaller reports. Small reports are good because they are easier to understand and update: there are fewer tables, fewer relationships between them and fewer fields to worry about. Also, not all reports work the same; sometimes you want to filter the projects shown based on a selected resource, and sometimes you want to filter the resources shown based on the selected project. Often, it just makes sense to setup the data model differently based on what the report is trying to illustrate, and you accomplish this by creating many reports (most companies have dozens).With P6-Reporter, this approach works fine. The data in those reports comes from the P6-Reporter database, so new data can be imported at the click of a button, but with XER based reports, the imported files are baked into the reports, so you will have to update the files in every report that you are currently maintaining. Remember the earlier estimate of 10 hours to update a report containing 60 projects each reporting cycle? Multiply that by the number of reports you are maintaining to get a ballpark number; it adds up quick.
Perhaps you are thinking that you could combine all of the report pages into a single report and update only that. This is not only possible, but if you are going to go the XER route, this may be your best option. Even with this approach, there is still a significant time cost. Unless it is kept to a reasonable size, the report will be a monster to maintain, fields will be harder to find among the many available and there may be duplicates, the relationships between the many tables will be hard to interpret and troubleshoot, and it will be difficult to know what can be changed in the report without adversely affecting existing visuals. Also, if you have more than one report developer, realize that not all reporting software allows you to blend separate reports to create a single one. They may have to develop new visualizations using sample data and then recreate them a second time in the “main” report.
Denormalization
The P6 database uses a much more complex table structure with many more tables than what are required for reporting. For example, if you wanted to create a simple report visual using the table structure found in XERs that contained project names, start dates, a project code and a UDF, it would take 7 tables:- The start date is available in the project table, but you’ll need to do some calculations to figure out what it is (more on that later)
- Surprisingly, the project name is not in the project table but in the PROJWBS table
- You’d have to read from 3 tables and apply some formulas to get each project code
- You’d have to read from 2 other tables and apply some formulas again to get each UDF
Seven tables may not sound like a lot, but that is just the project table. Many reports also include information about activities, resource assignments, and resources. Many also need information about activity steps, calendars or other details. All in all, you may use over 30 tables to create the same XER based report that can be done with using less than 10 tables from the P6-Reporter. But it’s not just the amount of tables, it’s that the report developer needs to first understand how the tables relate to one another which unless they have a strong background in programming, is a big ask in itself. Then they have to setup the reporting software so that it can determine the values. This isn’t just done once either; for every new code or UDF selected to include in your report, a calculated field will have to be created.
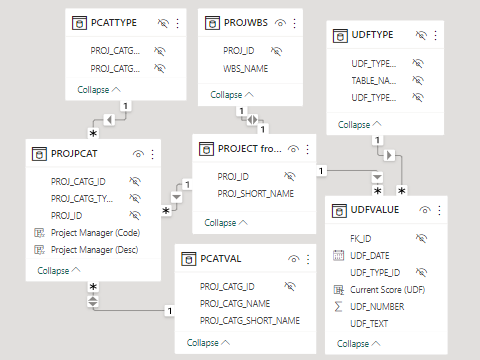
The XER tables required just to get project values
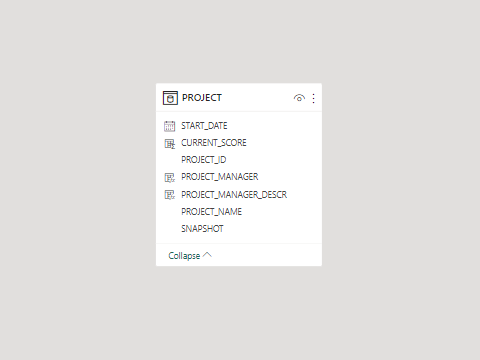
The equivalent table in P6-Reporter
Side note: The tables XERs use also tend to have rather unintuitive names such as PROJPCAT and PCATVAL. Their column names aren’t much better, such as PROJ_SHORT_NAM which actually stores the project id.
Field Availability
Many of the fields you see in P6, such as at completion total cost, earned value, cost performance index, duration % complete, and even start date are calculated using other fields by applying a formula. If you are creating XER based reports, then you’ll have to recreate these formulas yourself. Oracle does have some documentation that can give you an idea of how they’re calculated, and you may be able to find some suggestions on the web as to how they are written, but the calculations are baked into P6, and as far as we know, this code is not made public. You can try to reproduce them, but it is difficult to know if you have the formula correct. Just because you figured out a calculation for a Power BI report that usually matches what you see on your P6 client doesn’t mean it always will match. It’s a dangerous game to play because people at your company may make decisions based on the values that they see in your reports.Compare this to P6-Reporter: when capturing data it connects to P6 through its API, which not only means that all of the fields are available, they are also calculated in the exact same way as in the P6 application. This ensures that the values in your reports will always match the values you see in P6.
Spread Data
Spreads are a projection into the future. For example, if I had a resource, let’s say a crane operator, working on a job that was scheduled to take 120 hours and they could work 40 hours a week, then we could calculate that they would spend 3 weeks on that job. Spread data is useful for a number of reasons, one of which is to examine where resources will be used in the future, particularly where they are overallocated. In theory, by using XERs you’d have all of the information required to calculate spread data for your reports; however, it would require scripts that would likely take weeks to write and test (if your reporting software even supports that). A better solution would be to use P6-Reporter, which generates your spread data while it is capturing the snapshot.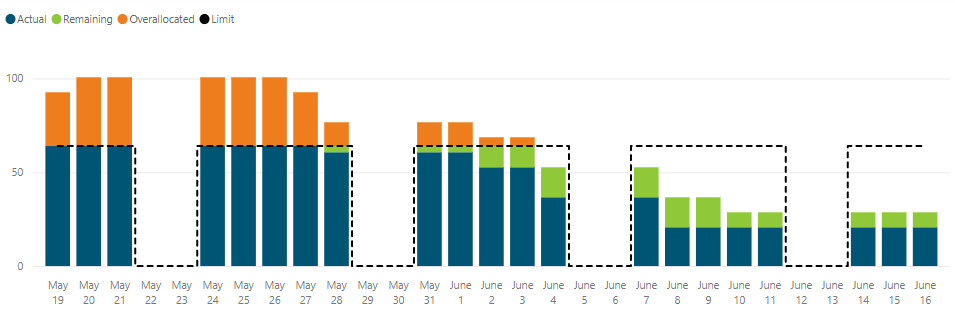
This Power BI visual, which shows resource allocation vs limits, can only be created using spread data.
Conclusion
If you are doing one or two simple reports based on a small number of projects and are adept at reverse engineering databases, then using XERs might be a way to save you some money. If you have many projects and want comprehensive reports, then a tool like P6-Reporter will cost you much less than the wages you’d pay employees to update the files manually, reverse-engineer P6 tables and formulas, and maintain unnecessarily complicated reports.About the Author
James Andrade - Integration Specialist
James is a professional software developer and was trained at SAIT in Calgary. He specializes in Primavera P6 report development using Power BI, Tableau and Oracle Data Visualization, from a variety of sources, including Primavera Data Warehouse, direct-to-P6 reporting and Emerald's own P6-Reporter.
