P6-Reporter - Project Reports at Your Fingertips
In this blog, we will look at couple of examples in Tableau and Power BI. These dashboards are not an all-inclusive list but meant as food for thought.
For example, the report below is grouped by System and Discipline and color coded on the type of work. Perhaps you require a report similar in display but grouped by location, sub grouped by area, and color coded showing resource concentration. Using codes and resource information from your project, you can display your project information in the format you require. You may want some additional filters which can be added with the required filters and using your project file information. Working with the coding structure in your project, the basic format creates a dashboard that gives your project group current information in an easy-to-digest format, showing exactly what they require.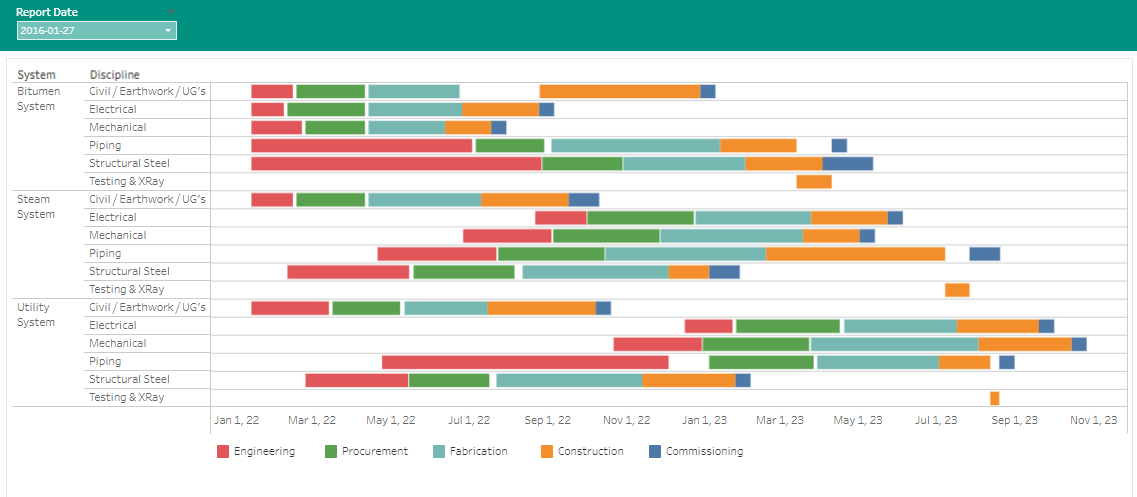
Displayed in Tableau (above)
Portfolio Overview in Power BI (below)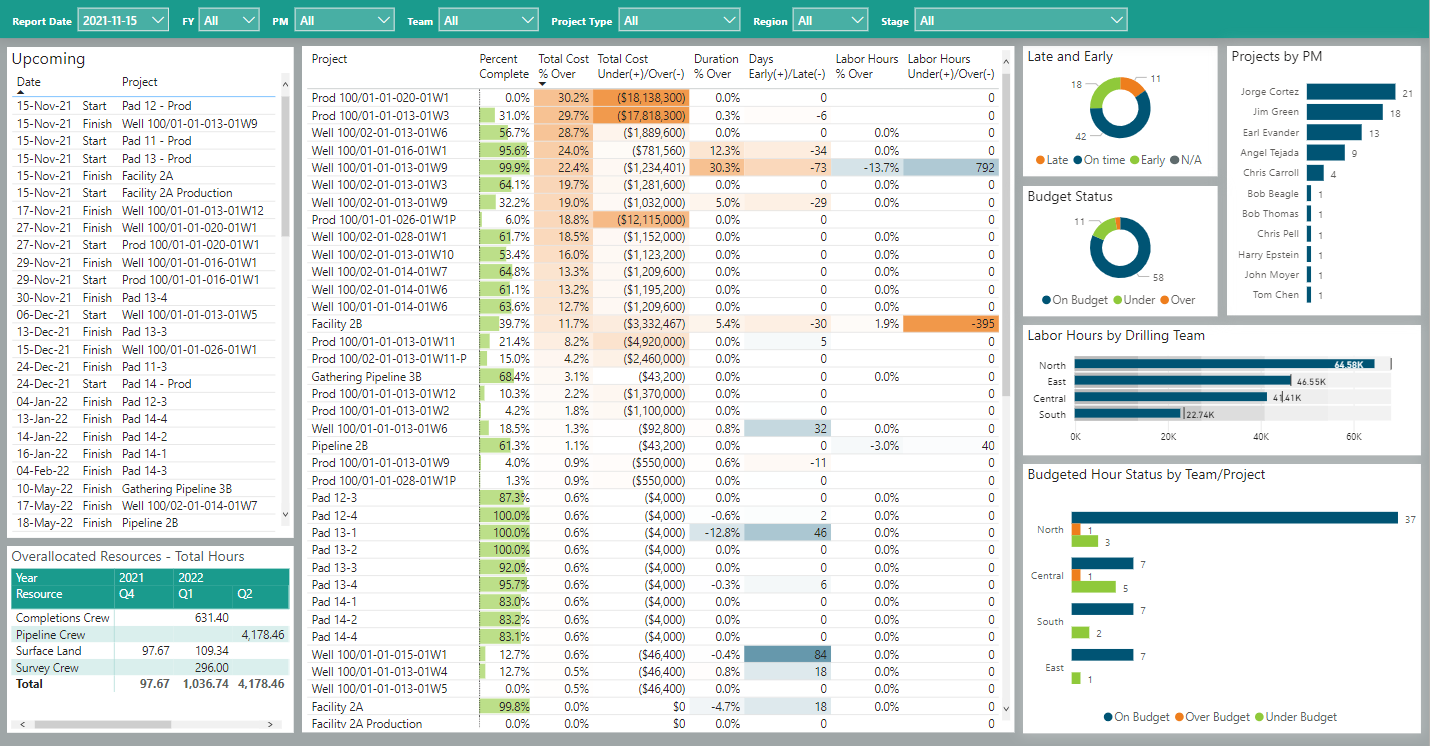
Above is a Portfolio Overview dashboard with a closer look at the self serve dashboard portlets below. Note the filters available at the top of the dashboard. With just a few mouse clicks, your team can focus on the exact information they require.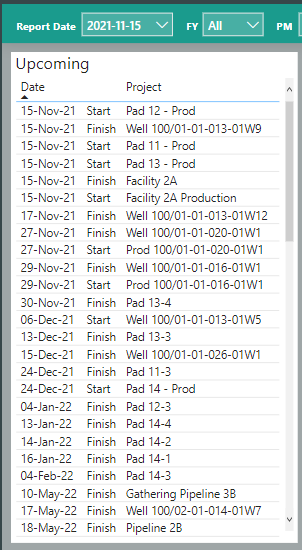
The Upcoming List (dashboard top left)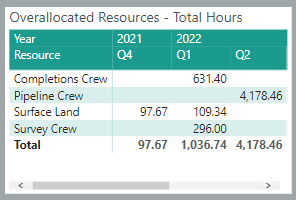
Over Allocated Resource Totals (Bottom left)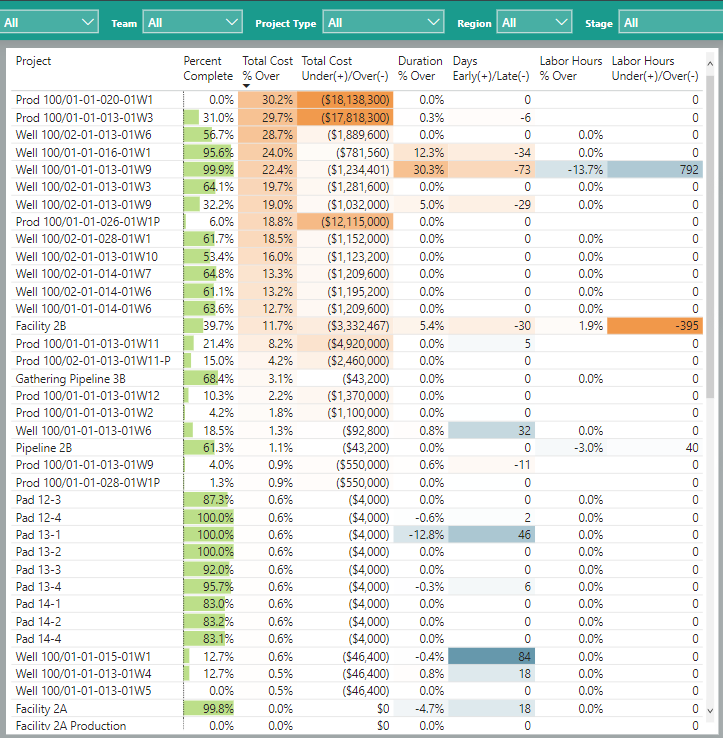
The Project list (middle section in the dashboard) can be sorted by clicking on the column headers. Clicking on a specific project in this section highlights where that same project information fits in the portlets on the right side of the dashboard. Use the filters at the top of the dashboard to filter the project list as required. The gradient color coding draws the eye to items you may need to dig further into. Keep in mind that the filters at the top of this dashboard allow you to compare previous snapshots of your portfolio to the current one for quick and easy comparison along with filters to create specific focus.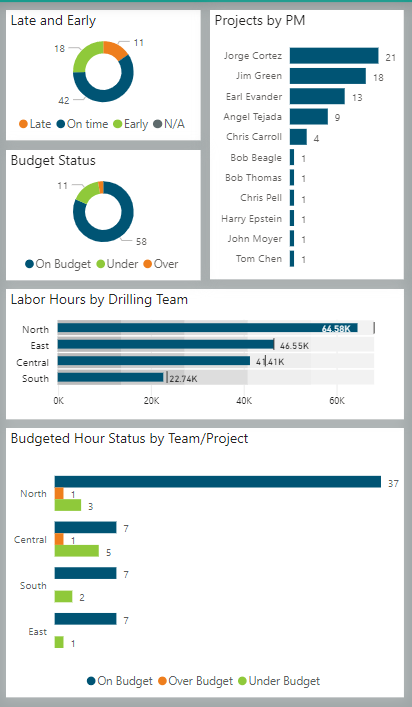
The portlets on the right side of the self-serve dashboard reflect the overall status of the portfolio projects by time, budget status, the number of projects being managed by each project manager, labor hours on the overall projects by Drilling Teams (the demo projects being used are drilling projects), and Budgeted Hour Status by Team/Project. Keep in mind the interactive side of the dashboard both by clicking to select a specific project in the project list but also using the filters available at the top of the dashboard.
Perhaps your role involves addressing resource allocation.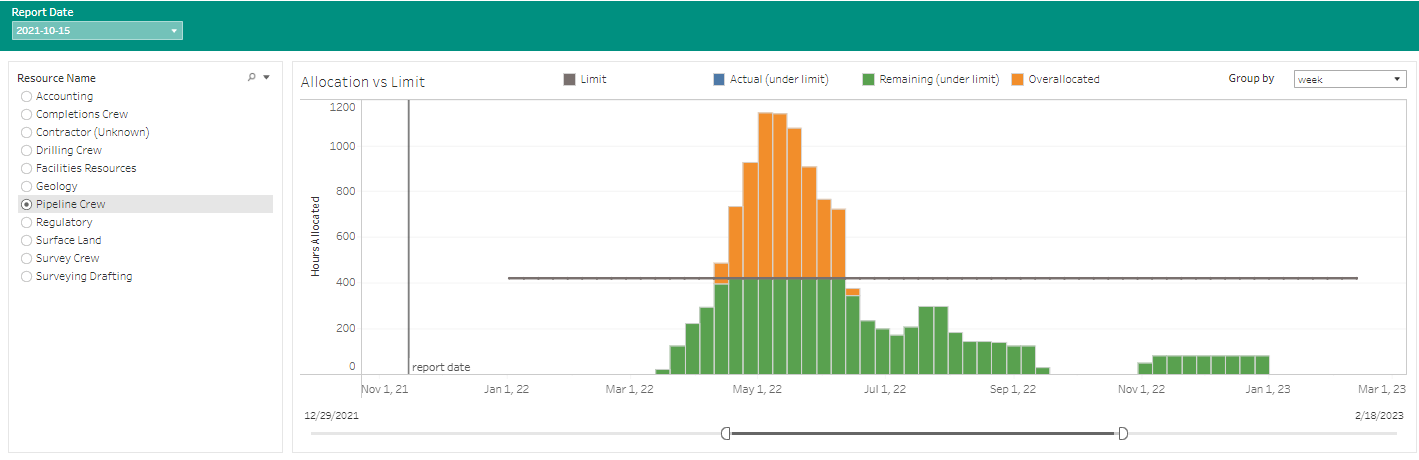
P6-Reporter resource profiles are available in a dashboard with portlets showing other resource related information using Tableau or Power BI. The self-serve dashboards provide filtering and an interactive information display when selecting specific pieces of information within the dashboard. The above screen shot is from Tableau.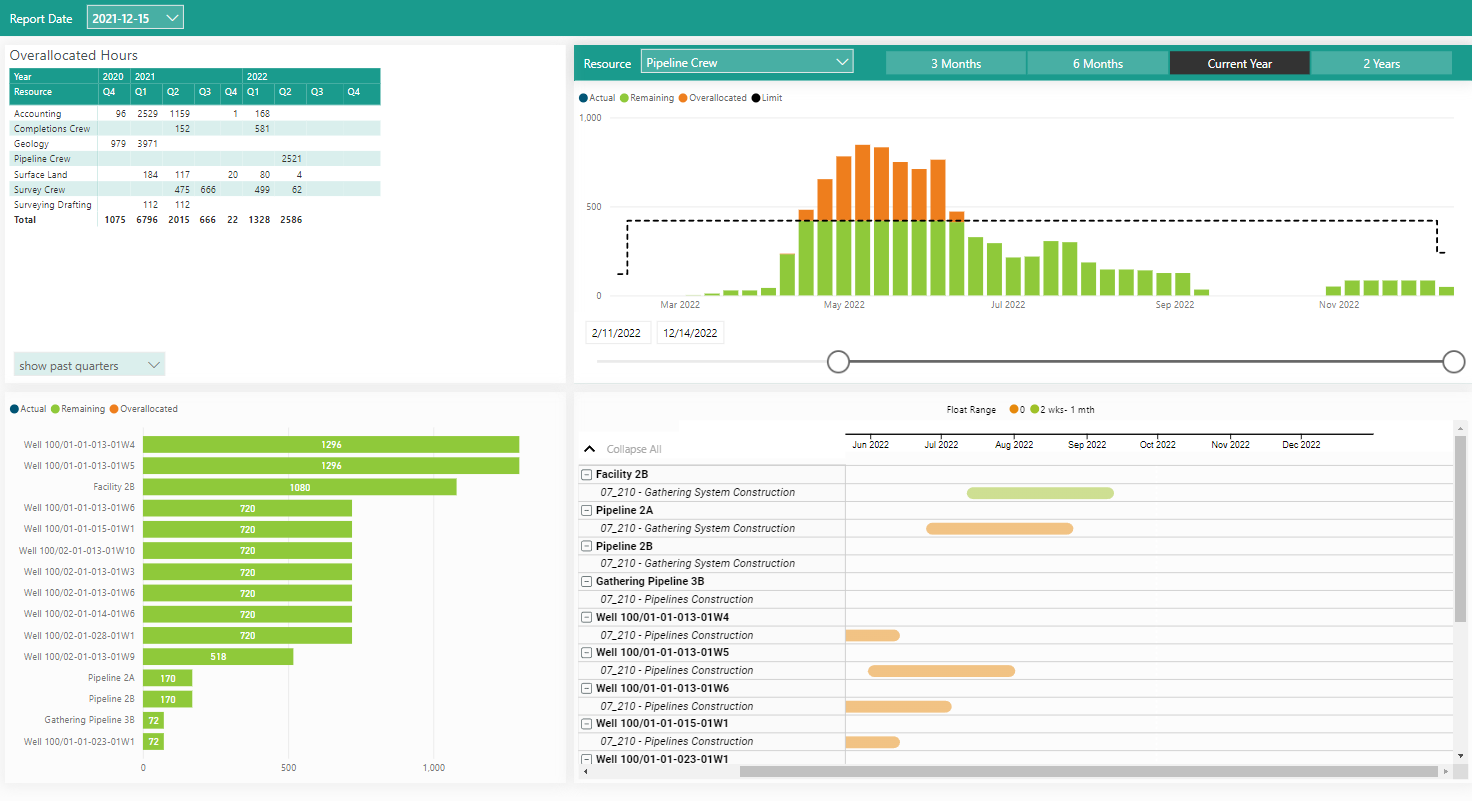
The Resource Allocation dashboard above is displayed in Power BI. Again, you can compare snap shots. You can also filter the resource you want to review using the filters and timeline configuration available above the resource profile. The projects and activities with that resource assigned are displayed in the bottom dashboard portlets.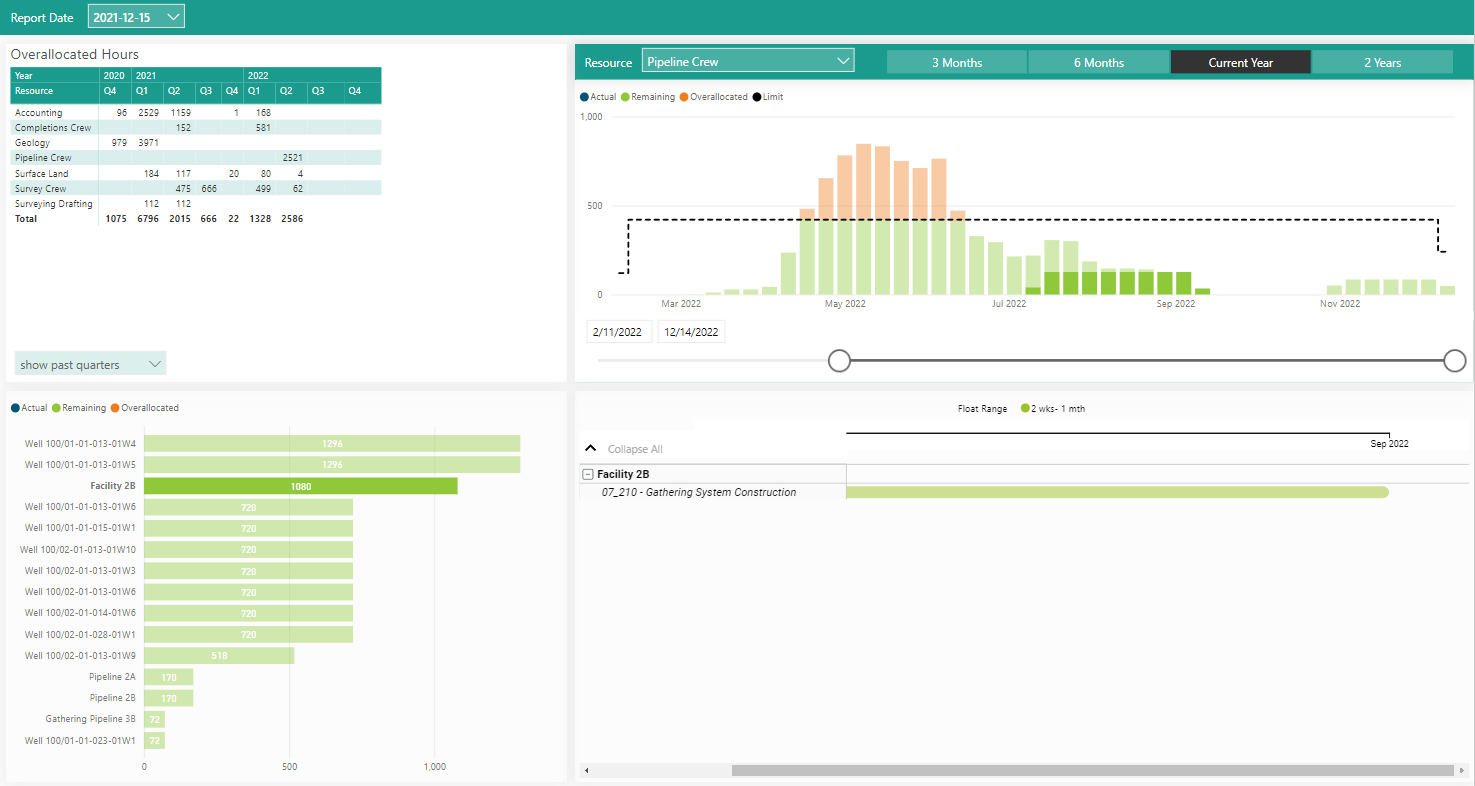
Clicking on a specific project (bottom left) highlights where in the resource profile for the selected resource (top right) the project fits. The project and activity the resource is assigned to is displayed in the bottom right portlet.
Add self-serve dashboards to your project communication. You will find improved communication on your projects with current, easy-to-digest information available to your team and an easy-to-use option to view previous snapshot information.
About the Author
Mary Lynn Backstrom, PMP, PMI-SP, PMI-BA – Implementation Specialist
Mary Lynn spent many years filling a variety of project controls duties such as planning, scheduling, analyzing, training and continuous improvement in the Aerospace Industry. Since joining Emerald in 2008, she has been a tremendous asset to the Emerald team. She has worked as a lead scheduler for turnarounds, led sessions for review and troubleshooting of scheduling and reporting, created and given custom training courses for clients, and is a sought after Primavera P6 trainer.
Mary Lynn enjoys some very diverse spare time activities. Along with a variety of outdoor activities such as gardening, she also enjoys making life size lawn ornaments for special holidays like Christmas. Mary Lynn is known for her participation in the community as well. You may have seen her walking in fundraisers in Edmonton and Calgary for the Cancer Society.
