Easy access to up-to-date, easy-to-digest reporting is available by including Power BI reports on your projects. Keep the process convenient and streamlined to allow your team to focus their efforts on the project while simply digesting the dashboard reports. P6-Reporter (previously EP-datawarehouse) brings with it a set of standard reports. That does not mean the users are confined to that specific set of reports. As additional reports are added to P6-Reporter, you will have access to all the new reports as well. You and your team can also add to the P6-Reporter report collection by creating additional reports yourselves. These options put you and your team in a position to not only fill all reporting requirements on your project but to streamline your reporting and improve project communication.
In this blog, we will look at couple of examples in Tableau and Power BI. These dashboards are not an all-inclusive list but meant as food for thought.
Written by Mary Lynn Backstrom, PMP, PMI-SP, PMI-BA – Implementation Specialist
on Wednesday, 05 October 2022.
Posted in All Articles, P6-Reporter
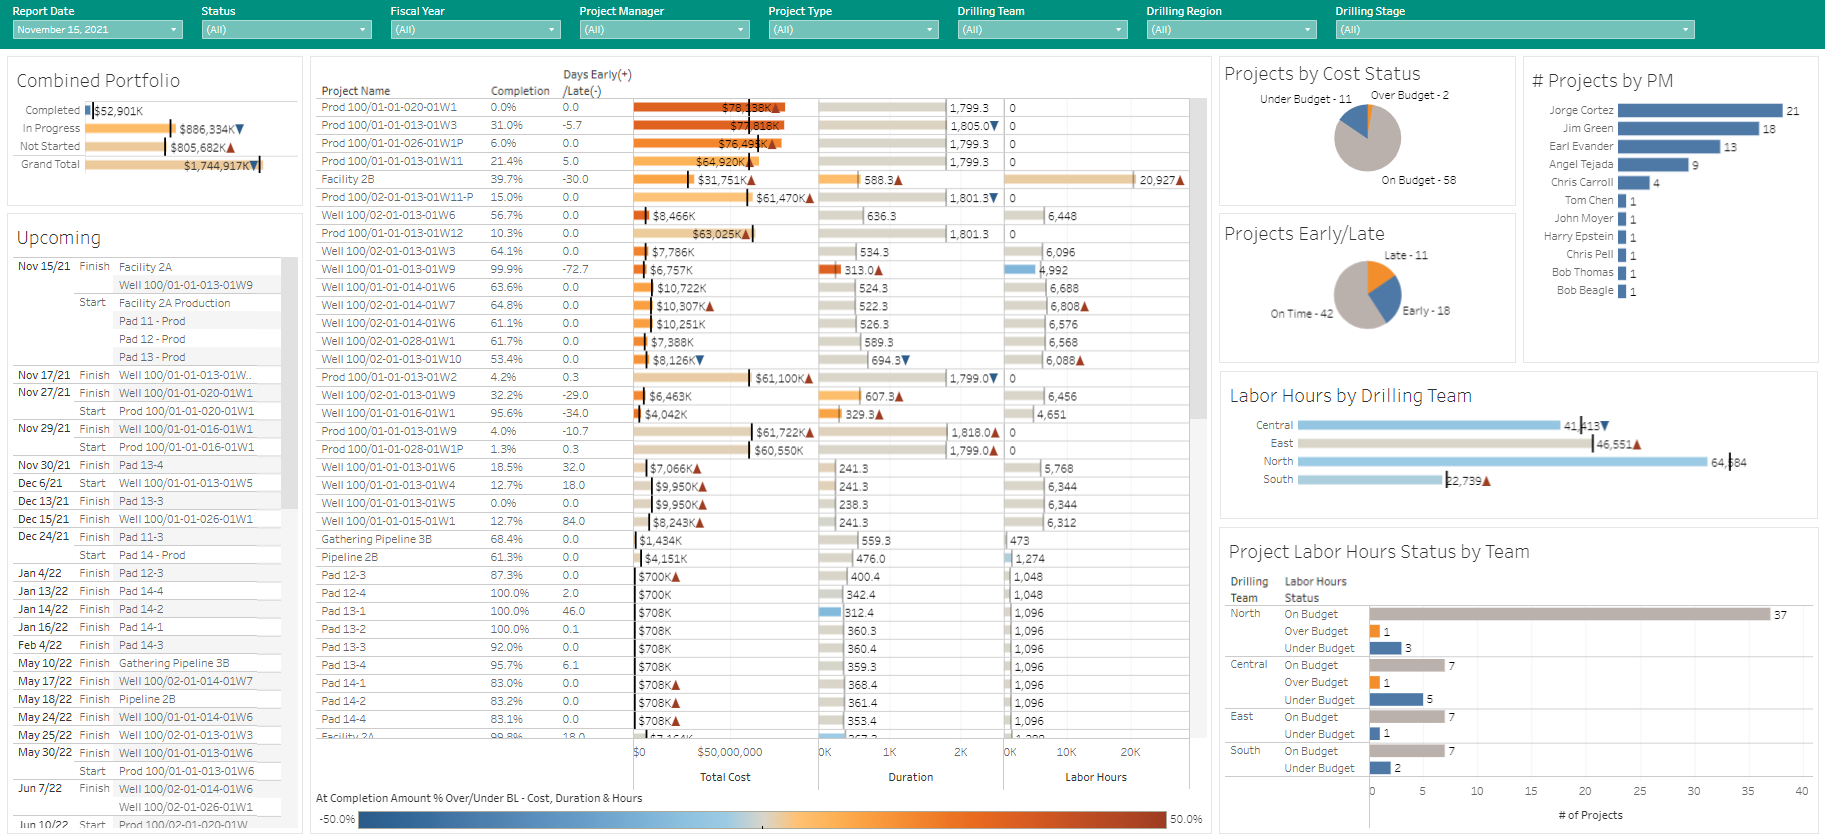
In P6-Reporter, the Portfolio Summary Self-Serve Dashboard provides easy access to portfolio level information. In the screen shot below, the user has summary information for all the projects in the portfolio displayed. Across the top of the dashboard are easy-to-use filters allowing the user to filter for exactly the information they need to focus on if the entire portfolio is not their current focus requirement. The report date indicates the snapshot information being displayed, and the user can filter for other snapshots if required. Previous snapshots remain available for display. Keep in mind, the snapshot process can be automated or manual.
Written by Mary Lynn Backstrom, PMP, PMI-SP, PMI-BA – Implementation Specialist
on Wednesday, 21 September 2022.
Posted in All Articles, P6-Reporter
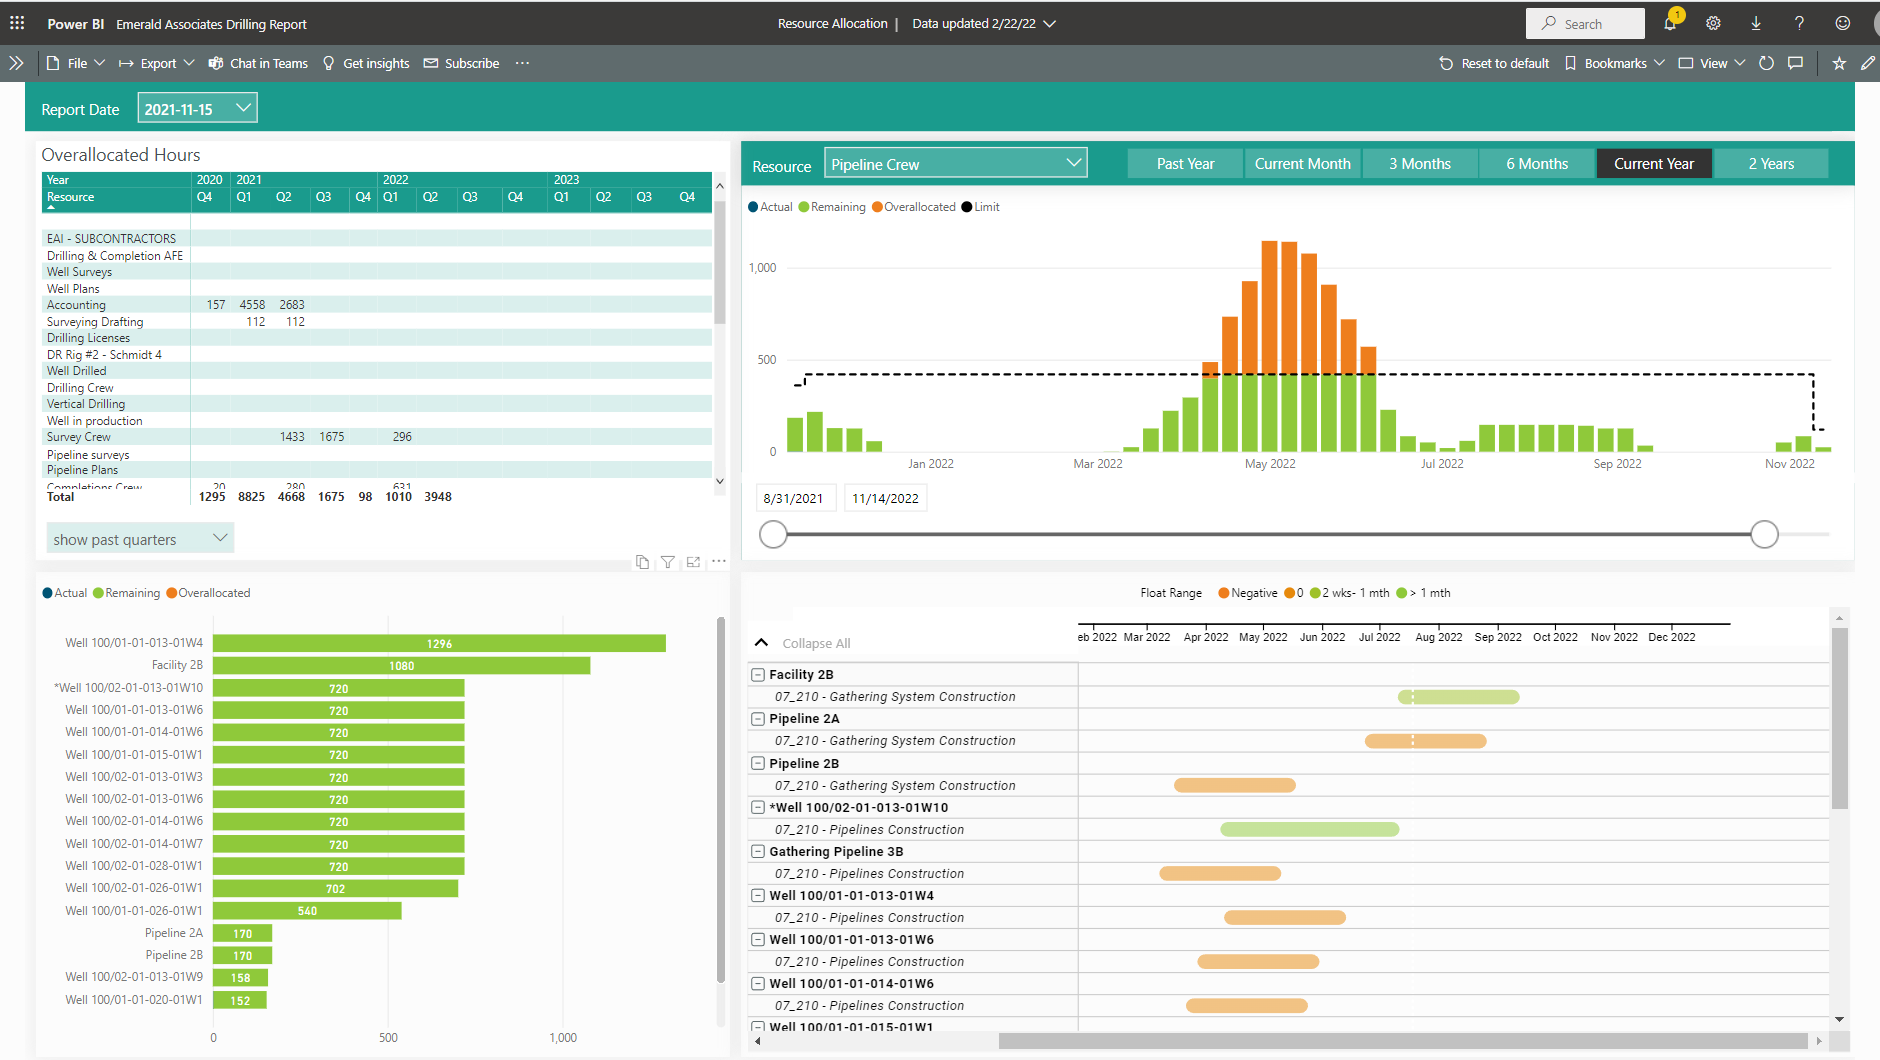
In P6-Reporter, the Resource Allocation Dashboard provides a portfolio level resource roll up. View over allocated hours (top left), all portfolio projects the selected resource is assigned to (bottom left), the portfolio resource profile (top right), and the portfolio projects and activity assignments in those projects via a Gantt view (bottom right).
Written by Mary Lynn Backstrom, PMP, PMI-SP, PMI-BA – Implementation Specialist
on Thursday, 01 September 2022.
Posted in All Articles, P6-Reporter
When you update your schedule, do you run your many reports out of P6? Or do you use another strategy? You can create layouts and reports that clearly indicate the activities requiring specific equipment, comparison to previous updates, and much more right out of P6. By providing your team with self-serve dashboards, those same reports can be included in Emerald’s P6-Reporter dashboards, giving your team access to all their required reports, automatically updated from current snapshots in a very easy to use format. Our self-serve dashboards give your team quick access to easy to digest report information so your team is all on the same page.
Written by Mary Lynn Backstrom, PMP, PMI-SP, PMI-BA – Implementation Specialist
on Friday, 22 July 2022.
Posted in All Articles, P6-Reporter
How do you track and report cancelled work in your project? By using P6-Reporter (previously EP-datawarehouse) and snapshots of your project you can not only view cancelled work but also monitor it over time using project snapshots. I have pulled many reports on cancelled work during project execution and after project completions. But can you easily access and present this information?
Written by Mary Lynn Backstrom, PMP, PMI-SP, PMI-BA – Implementation Specialist
on Friday, 17 June 2022.
Posted in All Articles, P6-Reporter
Does your turnaround self-serve dashboard(s) display easy to digest information on your turnaround’s current status? Does your team know where to look and what to look for to stay updated on progress?
If you’re still building your green up reports using Excel, there’s an easier way.
Written by Mary Lynn Backstrom, PMP, PMI-SP, PMI-BA – Implementation Specialist
on Tuesday, 17 May 2022.
Posted in All Articles, P6-Reporter, Turnarounds
As you’d likely expect, P6-Reporter (previously EP-datawarehouse) delivers you data in tables that represent your common P6 items: Projects, Activities, Resource Assignments, and Resources. There’s a lot you can do with these, but to create great reports, you’ll often want to manipulate these tables too:
- prepare the data, so it’s ready to feed your visuals
- prepare the data, so it can describe relationships between your data
- reduce the amount of information being passed in so that your reports are light and responsive
Written by James Andrade - Integration Specialist
on Tuesday, 01 March 2022.
Posted in All Articles, P6-Reporter
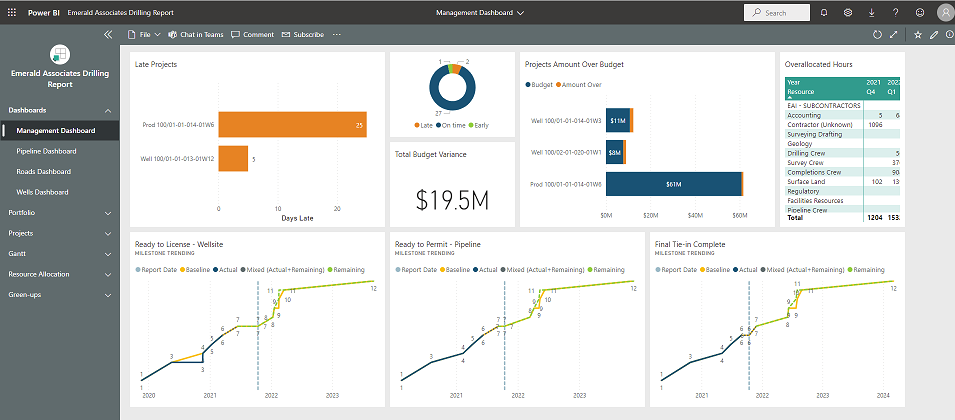
We have our project portfolio in P6. How can we quickly and easily access project information to see how the projects in our portfolio are progressing? Can we easily see where there are issues that need our attention? We can with self-serve dashboards in Power BI.
Written by Mary Lynn Backstrom, PMP, PMI-SP, PMI-BA – Implementation Specialist
on Monday, 14 February 2022.
Posted in All Articles, P6-Reporter
More charts. More insight. Understand your projects in ready to use, customizable reports in Power BI, Tableau or ODV.
Written by James Andrade
More charts. More insight. Understand your projects in ready to use, customizable reports in Power BI, Tableau or ODV.
New Features
-
New charts for resource allocation - see at a glance which resources are overallocated, then select a resource to see which dates are affected, which projects are using it, and how much float you have in each.
-
Gantt charts - select a resource and view how it is allocated across a series of projects.
-
Milestone Trending - see any of your milestones across your portfolio: where they're planned to be, where they are now, and if they're behind, how quickly you can expect to get caught up.
Enhancements
-
Green-ups are now expandable. Want to know the percent completion for each activity in a category and not just the category itself? Now you can.
-
More trending! Is your project headed in the right direction? Perhaps you've had a major setback and are getting caught-up, or perhaps you're falling steadily behind. Looking at current numbers only tells half the story. P6-Reporter reports are the only way to see where your Primavera P6 projects have been so that you can tell where they are going. In here you'll find trending information for all costs, finish date and duration variances, as well as CPI and SPI over the course of your project.
P6-Reporter News Articles
on Monday, 14 February 2022.
Posted in News, P6-Reporter
After I wrote my last blog, a co-worker asked me why I would want to store period actuals in the data warehouse when it seems as though I can get the same value from the historical data in the data warehouse.
Both Oracle’s Primavera Analytics and our P6-Reporter (previously EP-datawarehouse) support capturing some kind of historical data – data that shows what the information in P6 looked like at some point in the past. It’s fairly easy to see how this historical data can be exploited to produce information that is in concept very similar to what you get from the financial period actuals.
Written by Dan MacMillan - Integration Specialist
on Wednesday, 30 December 2015.
Posted in All Articles, P6-Reporter, Primavera P6
Accommodating the March of Time
As any project manager or scheduler will tell you, Primavera P6 is a great tool for project planning and execution. P6 is designed to allow you to manage cost, schedule, and resource information in as much detail as you want. It allows you to know where you are on a project and what is coming up, potential issues, what absolutely must be done on time to prevent project delivery from being delayed, and so on. This is all tactical information and P6 has an outstanding feature set to help manage it.
The same information in P6 that has such tactical value can also have huge strategic value. The detailed schedule documents, not only when certain work will be done, but when specific resources such as labour, equipment, materials, and money will be required. Summarizing this time-distributed resource information to the project level or higher provides a big picture view of the project's projected resource and spend profiles over time.
Written by Dan MacMillan - Integration Specialist
on Wednesday, 25 February 2015.
Posted in All Articles, P6-Reporter, Primavera P6

