P6-Reporter – Streamline Your Project Reporting
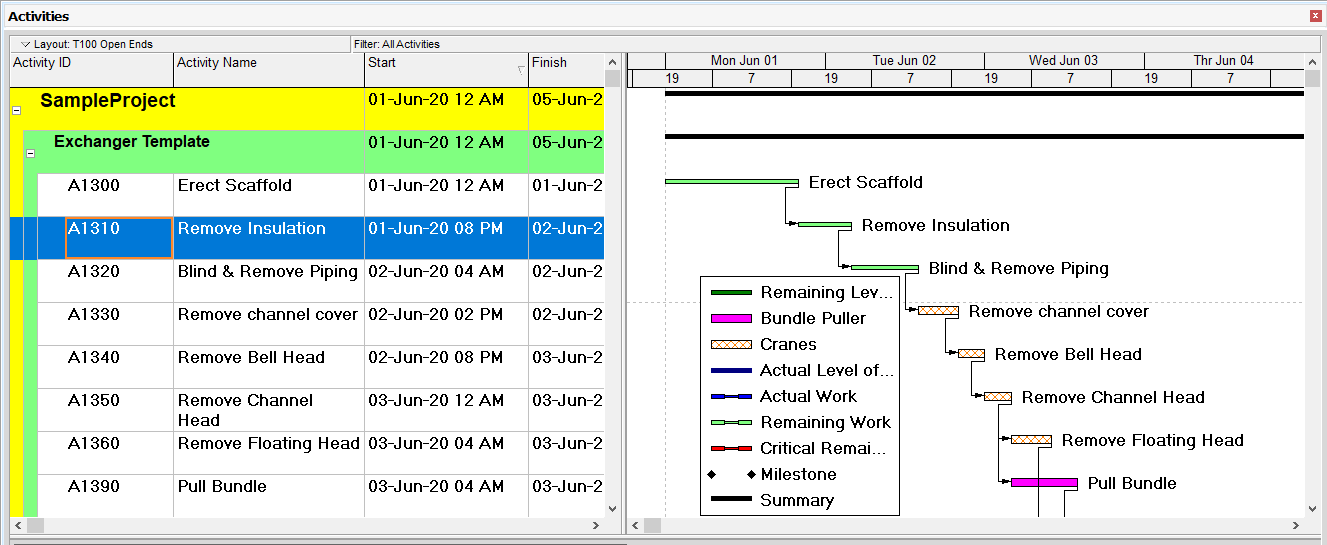
Above is a simple example of a Gantt chart from P6 clearly identifying the activities requiring a Bundle Puller or Crane. This type of layout can be created in a number of configurations to report on specific elements. All this information can be created in a dashboard report and automatically updated from snapshots. Users only have to access the reports in the dashboard, change the filters if the most current is not what they require at the time, and use the information. They do not have to request the report or login to P6 to run the report. The dashboard reports give your team quick access to current update information in an easy to use and easy to digest format.
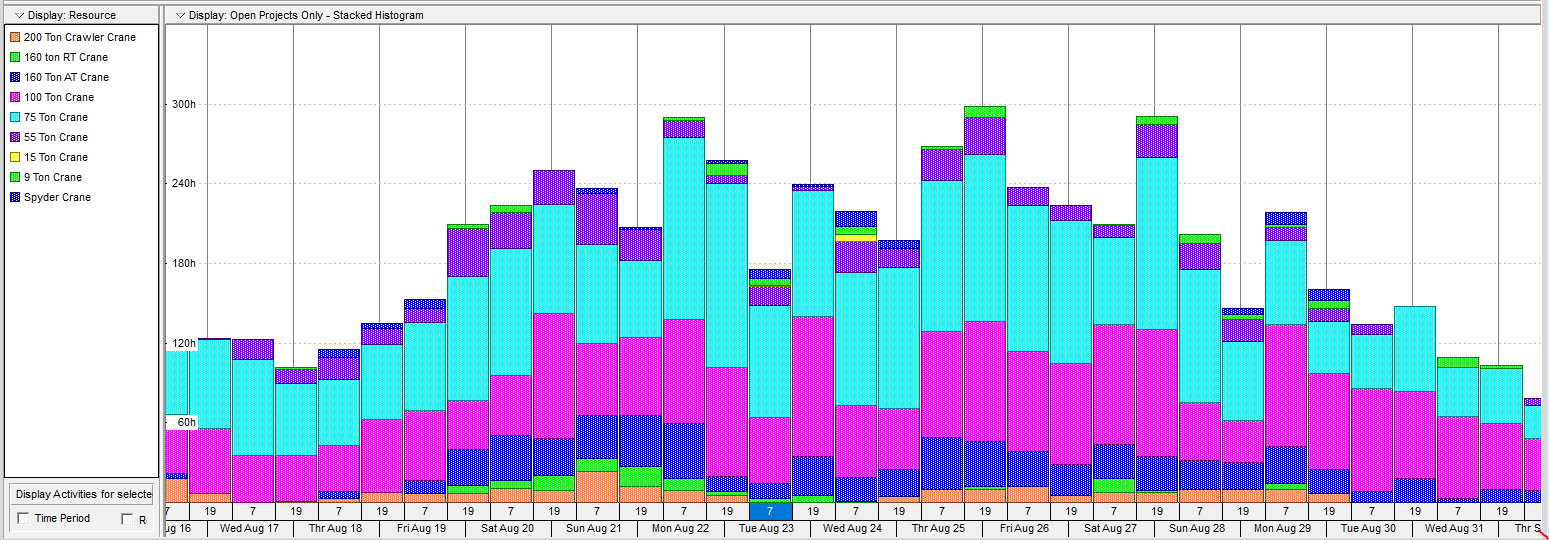
Resource/equipment profiles created in P6 can be recreated in P6-Reporter dashboard reports using automatic snapshots to keep the information current, while still retaining access to view previous snapshot information as required.
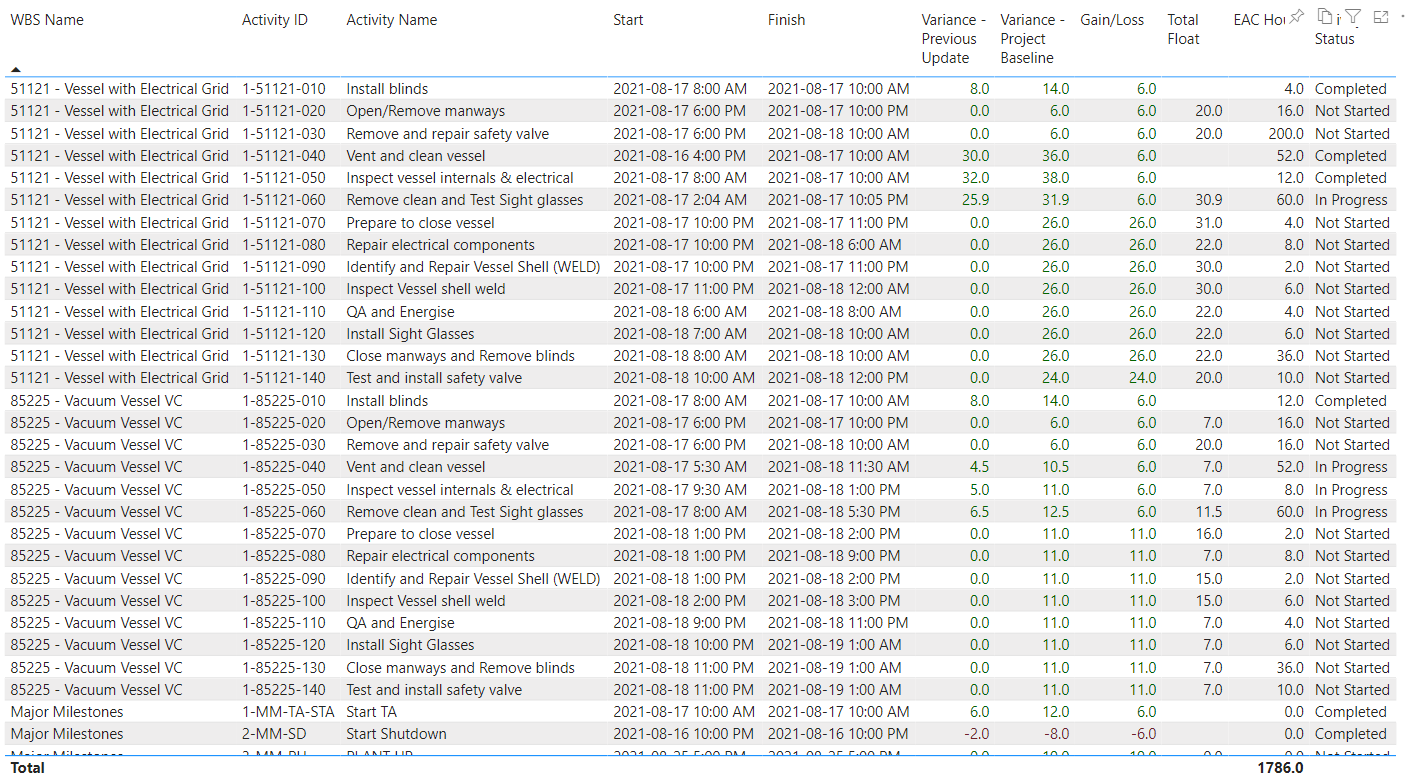
Above is a sample of data comparison, current update to previous update. This is a P6-Reporter report displayed in Power BI.
Automatically generating the reports your team requires and providing access via self serve dashboards streamlines the reporting process. The project team has easy access to the information they require in an easy to digest format.
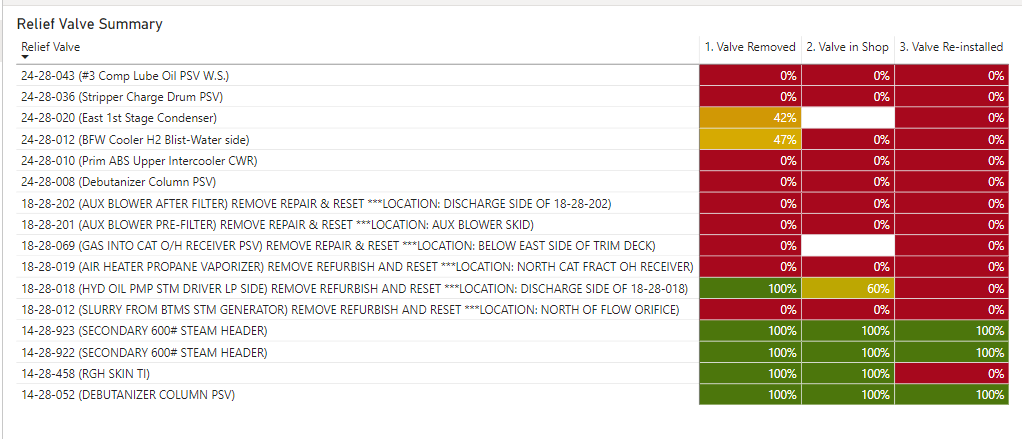
Green Up reports provide easy access to up to date information. See at a glance where issues are and base decisions on the latest update information for the project. (P6-Reporter – Power BI Report)
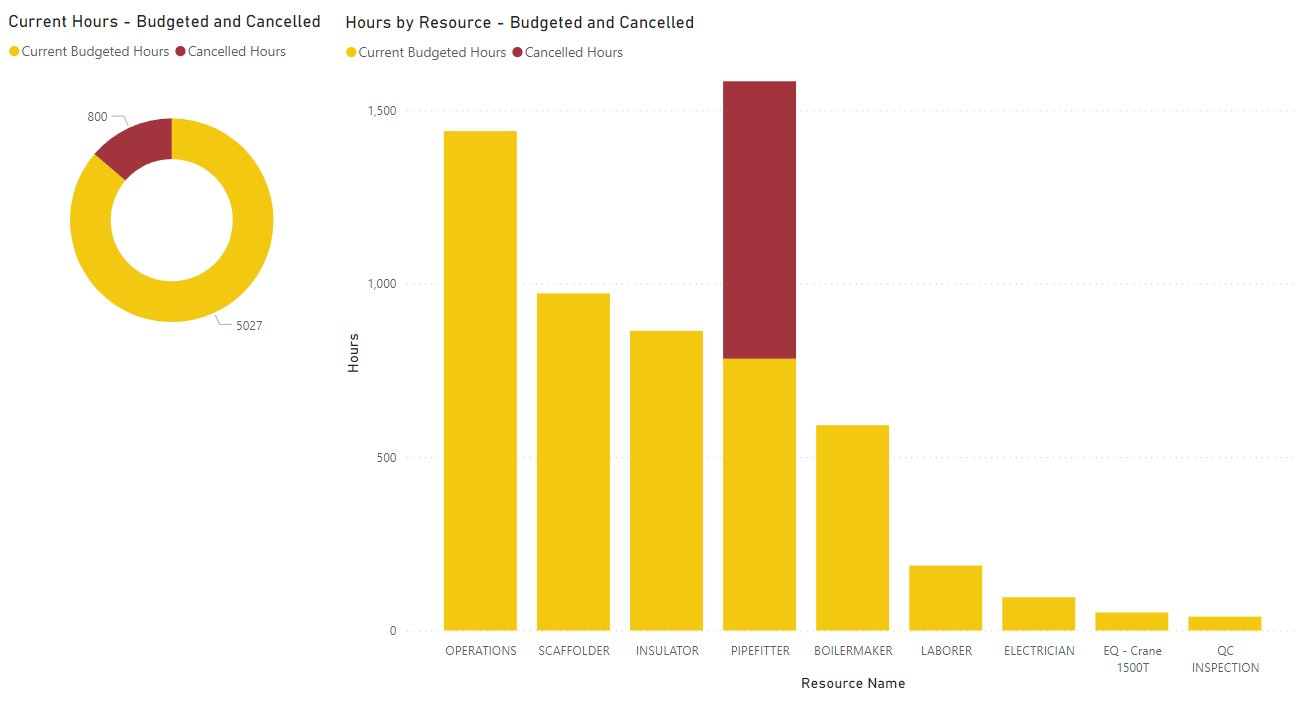
Track cancelled work by resource, WBS, or activity code and have totals at your fingertips as the project is executed.
Streamline reporting by utilizing P6-Reporter self serve dashboards. Provide the best tools for your project team.
About the Author
Mary Lynn Backstrom, PMP, PMI-SP, PMI-BA – Implementation Specialist
Mary Lynn spent many years filling a variety of project controls duties such as planning, scheduling, analyzing, training and continuous improvement in the Aerospace Industry. Since joining Emerald in 2008, she has been a tremendous asset to the Emerald team. She has worked as a lead scheduler for turnarounds, led sessions for review and troubleshooting of scheduling and reporting, created and given custom training courses for clients, and is a sought after Primavera P6 trainer.
Mary Lynn enjoys some very diverse spare time activities. Along with a variety of outdoor activities such as gardening, she also enjoys making life size lawn ornaments for special holidays like Christmas. Mary Lynn is known for her participation in the community as well. You may have seen her walking in fundraisers in Edmonton and Calgary for the Cancer Society.
