P6-Reporter - Project Detail Dashboard
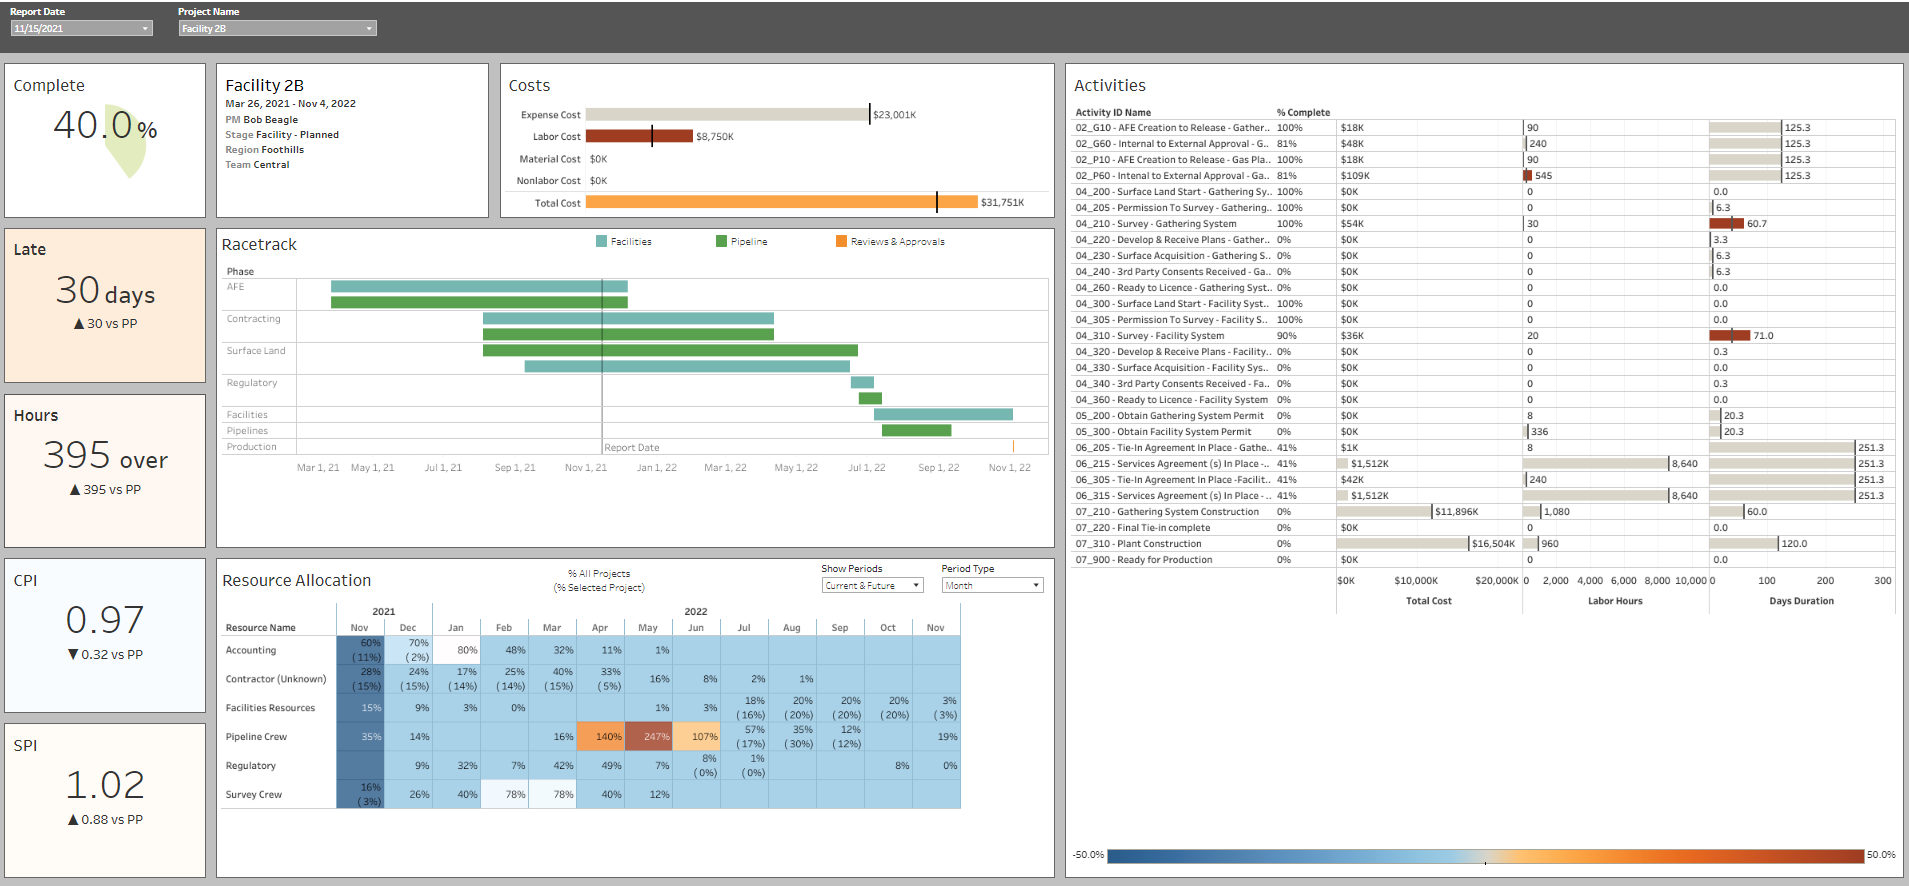
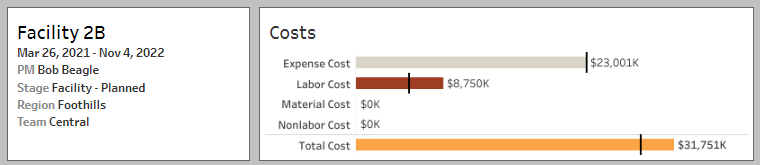
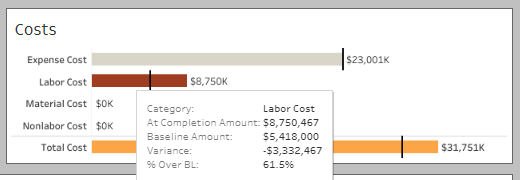
Project Details Information (top left of the dashboard) gives you project details and cost details. Place your mouse over any cost bar and a text box displays additional information (see below).
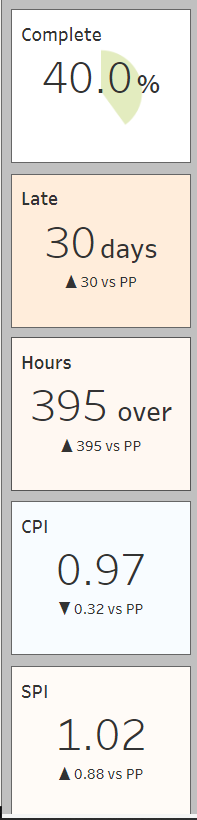
Located at the left side of the dashboard, these displays (below) provide easy access to percent complete, late status, hours (over or under as applicable), CPI and SPI for the project. The bottom four elements include a trending icon for quick reference.
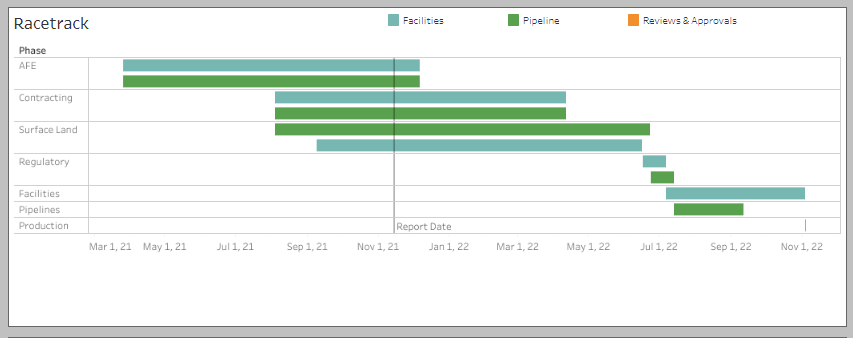
Phase Racetrack color coded by work type:
This report displays an easy to digest view of the project work by phase and work type over time. Keep in mind that this is food for thought, and you can have project data rolled up on criteria specific to your projects.
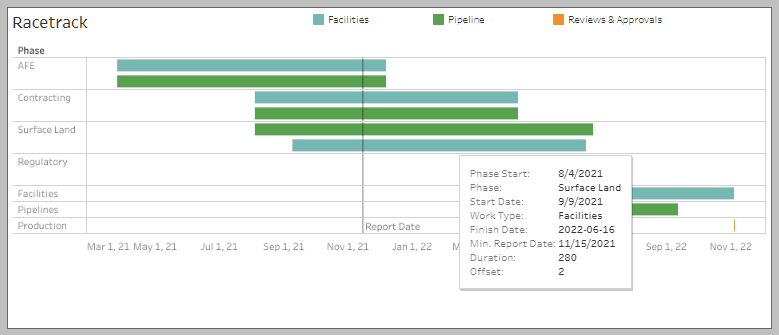
Place your mouse pointer over the Surface Land phase bar and the additional text information dialogue box displays for that roll up.
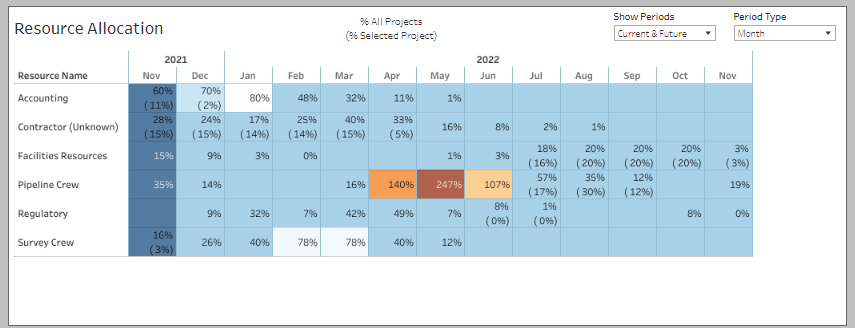
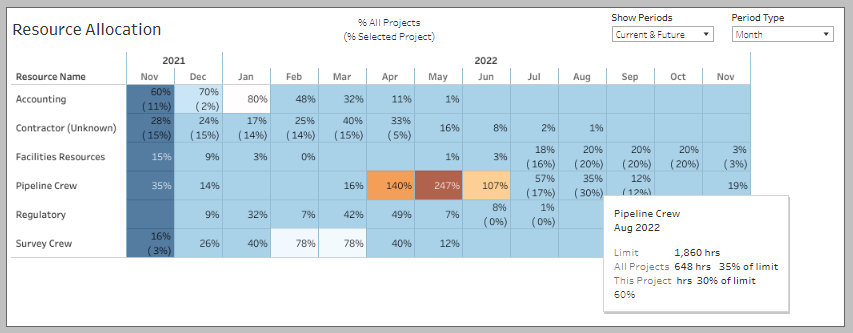
The resource allocation display also gives some easy to digest and interesting information.
As before, simply place your mouse pointer over the Pipeline Crew resource for June 2022, and we can see in the details dialogue that the required hours are 107% of the limit for that resource. The color coding helps to draw your eye quickly to areas where you may need to investigate further.
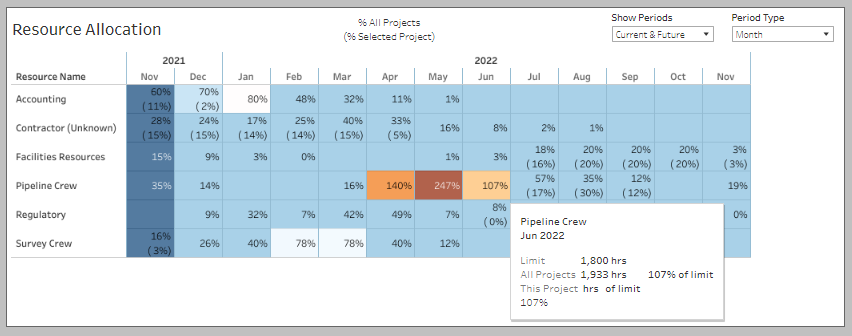
Place your mouse over the Pipeline Crew for August 2022, and you have two percentages displayed. The percentage of the available resource for all projects and the percentage of the resource availability (limit) for this specific project are displayed.
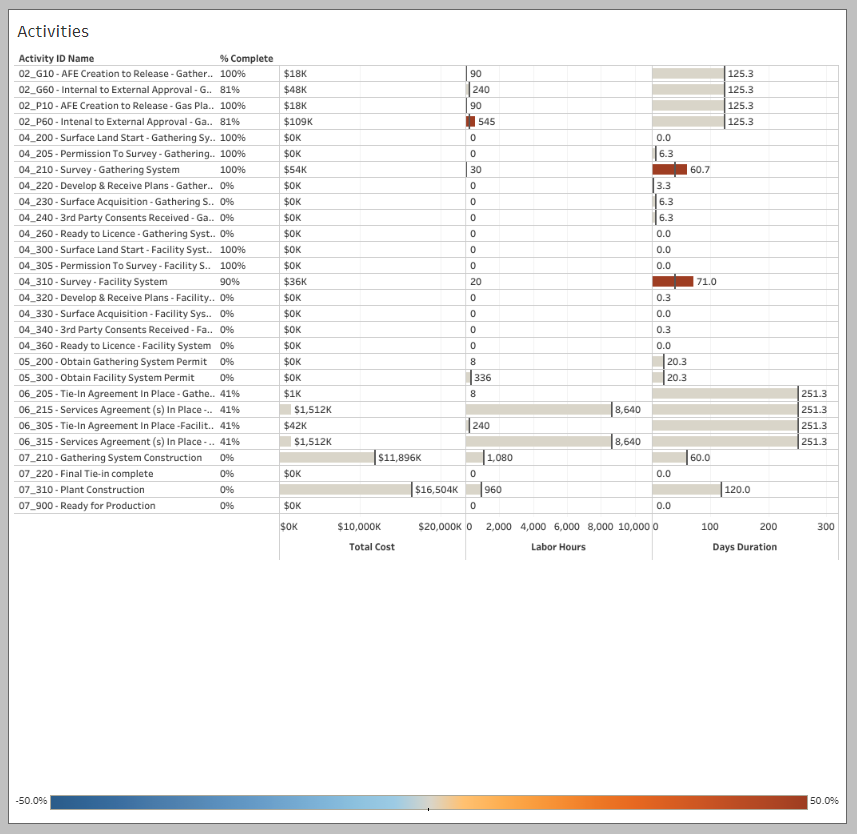
Activities percent complete, total cost, labor hours and duration (days):
Cost, hours and duration by activity including color coding for quick reference.
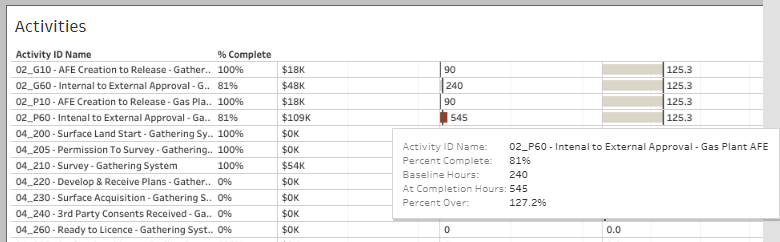
As before, place your mouse pointer over the red hours bar (02_P60 below) to display the detail dialogue box.
The Project Detail Dashboard is another easy to use, self-serve dashboard available with P6-Reporter, providing current easy to digest information.
P6-Reporter provides the functionality for snap shots which feed your snapshot information directly to your self-serve dashboards. Having current information available in an easy to digest format helps to improve team communication and timely informed project decisions.
About the Author
Mary Lynn Backstrom, PMP, PMI-SP, PMI-BA – Implementation Specialist
Mary Lynn spent many years filling a variety of project controls duties such as planning, scheduling, analyzing, training and continuous improvement in the Aerospace Industry. Since joining Emerald in 2008, she has been a tremendous asset to the Emerald team. She has worked as a lead scheduler for turnarounds, led sessions for review and troubleshooting of scheduling and reporting, created and given custom training courses for clients, and is a sought after Primavera P6 trainer.
Mary Lynn enjoys some very diverse spare time activities. Along with a variety of outdoor activities such as gardening, she also enjoys making life size lawn ornaments for special holidays like Christmas. Mary Lynn is known for her participation in the community as well. You may have seen her walking in fundraisers in Edmonton and Calgary for the Cancer Society.
